|
Download Data (XLS File) |
|
||||||||
|
||||||||
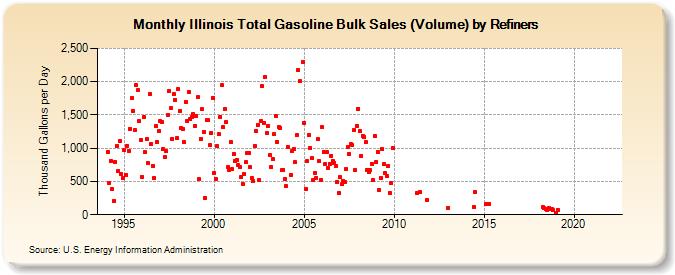
| Illinois Total Gasoline Bulk Sales (Volume) by Refiners (Thousand Gallons per Day) | ||||||||
| Year | Jan | Feb | Mar | Apr | May | Jun | Jul | Aug | Sep | Oct | Nov | Dec |
|---|---|---|---|---|---|---|---|---|---|---|---|---|
| 1994 | W | 942.4 | 481.5 | 811.9 | 386.6 | 210.5 | 799.2 | 1,036.4 | 653.8 | 1,112.2 | 609.1 | 549.0 |
| 1995 | 970.9 | 597.0 | 1,040.0 | 964.6 | 1,294.4 | 1,750.7 | 1,557.4 | 1,266.2 | 1,949.5 | 1,869.4 | 1,404.9 | 1,119.5 |
| 1996 | 571.7 | 1,468.0 | 940.6 | 1,141.1 | 772.0 | 1,812.4 | 1,069.3 | 735.1 | 552.6 | 1,336.1 | 1,092.7 | 1,251.7 |
| 1997 | 1,402.4 | 1,396.8 | 988.4 | 861.8 | 957.8 | 1,504.0 | 1,858.9 | 1,598.7 | 1,136.4 | 1,818.1 | 1,730.3 | 1,149.5 |
| 1998 | 1,887.3 | 1,555.8 | 1,306.9 | 1,283.7 | 1,088.9 | 1,700.4 | 1,408.4 | 1,844.1 | 1,431.7 | 1,474.5 | 1,511.3 | 1,334.6 |
| 1999 | 1,487.1 | 1,761.9 | 533.0 | 1,140.2 | 1,581.5 | 1,248.3 | 254.2 | 1,420.6 | 1,419.7 | 1,043.8 | 1,225.4 | 1,761.5 |
| 2000 | 632.9 | 533.2 | 1,026.5 | 1,214.3 | 1,473.0 | 1,944.4 | 1,311.0 | 1,588.3 | 1,392.8 | 712.4 | 676.6 | 1,091.3 |
| 2001 | 684.8 | 913.0 | 814.3 | 826.8 | 749.7 | 717.2 | 559.9 | 467.2 | 607.5 | 788.3 | 931.8 | 935.0 |
| 2002 | 712.0 | 555.1 | 501.4 | 1,036.4 | 1,254.2 | 1,351.9 | 515.0 | 1,402.7 | 1,932.9 | 1,375.3 | 2,068.3 | 1,225.5 |
| 2003 | 1,337.1 | 897.3 | 710.3 | 837.3 | 1,209.7 | 1,487.2 | 1,097.9 | 1,319.3 | 1,302.0 | 667.3 | 675.8 | 536.1 |
| 2004 | 426.6 | 1,016.9 | W | 604.0 | 957.6 | 988.5 | 784.9 | 1,195.9 | 2,175.0 | 2,003.9 | W | 2,296.7 |
| 2005 | 1,383.0 | 390.8 | 801.5 | 1,194.9 | 1,000.2 | 850.6 | 515.0 | 627.9 | 557.6 | 1,131.7 | 806.2 | 528.8 |
| 2006 | 1,313.4 | 950.0 | 763.7 | 942.5 | 698.4 | 769.3 | 886.7 | 813.1 | 784.7 | 738.9 | 492.9 | 329.3 |
| 2007 | 569.4 | 457.3 | 511.2 | 486.9 | 687.1 | 1,017.4 | 917.0 | 1,056.3 | 1,052.7 | 1,271.3 | 671.0 | 1,339.4 |
| 2008 | 1,594.1 | 1,251.4 | 879.2 | 1,188.2 | 1,172.4 | 1,086.0 | 676.5 | 635.7 | 668.1 | 765.0 | 518.5 | 1,183.8 |
| 2009 | 792.9 | 945.6 | 374.2 | 551.0 | 988.9 | 762.2 | 620.5 | 580.3 | 736.8 | 332.0 | 475.3 | 1,001.2 |
| 2010 | W | W | W | W | W | W | W | W | W | W | W | W |
| 2011 | W | W | W | 329.8 | W | 340.9 | W | W | W | W | 220.9 | W |
| 2012 | W | W | W | W | W | W | W | W | W | W | W | W |
| 2013 | 104.8 | W | W | W | W | W | W | - | W | W | W | W |
| 2014 | W | W | W | W | W | 116.5 | 334.8 | W | W | W | W | W |
| 2015 | W | 160.5 | W | 161.8 | W | W | W | W | W | W | W | W |
| 2016 | W | W | W | W | W | W | W | W | W | W | W | W |
| 2017 | W | W | W | W | W | W | W | W | W | W | W | W |
| 2018 | W | W | W | 116.9 | 95.7 | 86.0 | 69.6 | 94.4 | 81.1 | 90.6 | 67.0 | NA |
| 2019 | 20.0 | 76.1 | W | W | W | W | W | W | W | W | W | W |
| 2020 | W | W | W | W | W | W | W | W | W | W | W | W |
| 2021 | W | W | W | - | - | - | W | W | W | W | W | W |
| 2022 | W | - | W | |||||||||
| - = No Data Reported; -- = Not Applicable; NA = Not Available; W = Withheld to avoid disclosure of individual company data. |
| Release Date: 6/1/2022 |
| Next Release Date: TBD |