|
Download Data (XLS File) |
|
||||||||
|
||||||||
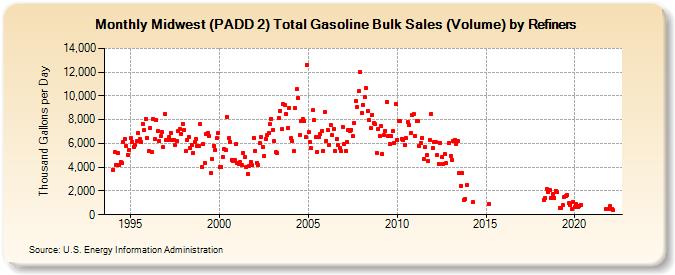
| Midwest (PADD 2) Total Gasoline Bulk Sales (Volume) by Refiners (Thousand Gallons per Day) | ||||||||
| Year | Jan | Feb | Mar | Apr | May | Jun | Jul | Aug | Sep | Oct | Nov | Dec |
|---|---|---|---|---|---|---|---|---|---|---|---|---|
| 1994 | 3,799.3 | 5,265.7 | 4,225.3 | 5,165.7 | 4,209.2 | 4,439.0 | 4,342.0 | 6,130.6 | 6,368.9 | 5,784.3 | 5,052.1 | 5,469.2 |
| 1995 | 6,429.2 | 6,155.8 | 5,738.2 | 5,852.2 | 6,171.0 | 6,847.7 | 6,331.9 | 6,130.8 | 7,636.2 | 7,089.8 | 8,079.5 | 6,486.1 |
| 1996 | 5,358.4 | 7,337.9 | 5,296.7 | 8,097.3 | 6,335.7 | 7,997.0 | 7,037.9 | 6,224.5 | 6,615.3 | 6,981.2 | 5,699.1 | 8,487.4 |
| 1997 | 6,324.9 | 6,305.3 | 6,550.0 | 6,885.8 | 6,268.6 | 6,275.5 | 5,834.3 | 6,241.2 | 7,016.6 | 7,173.6 | 6,798.7 | 7,662.3 |
| 1998 | 7,127.0 | 5,339.1 | 6,283.9 | 6,533.4 | 5,607.5 | 5,902.8 | 5,206.9 | 6,093.5 | 6,386.8 | 5,773.0 | 5,800.9 | 7,594.1 |
| 1999 | 4,027.6 | 5,952.2 | 4,394.6 | 6,823.9 | 6,886.6 | 6,611.7 | 3,508.1 | 4,704.3 | 5,817.8 | 5,459.7 | 6,420.4 | 6,880.4 |
| 2000 | 3,975.7 | 4,049.2 | 4,897.6 | 5,516.7 | 5,423.6 | 8,265.8 | 6,431.2 | 6,152.6 | 4,647.5 | 4,547.9 | 4,611.9 | 5,968.0 |
| 2001 | 4,343.1 | 4,255.9 | 4,416.7 | 4,211.6 | 5,218.2 | 4,875.1 | 3,978.3 | 3,468.6 | 4,105.5 | 4,452.9 | 4,159.1 | 6,486.5 |
| 2002 | 5,390.7 | 4,394.9 | 4,180.2 | 6,050.4 | 6,508.7 | 5,730.9 | 4,924.2 | 6,408.6 | 6,694.2 | 6,917.6 | 7,609.7 | 8,093.9 |
| 2003 | 7,145.3 | 6,173.2 | 5,247.5 | 5,196.6 | 8,123.1 | 8,755.9 | 7,193.1 | 9,315.6 | 9,239.3 | 8,494.5 | 7,296.7 | 8,999.9 |
| 2004 | 6,420.7 | 6,235.4 | 5,322.2 | 8,965.8 | 10,550.1 | 9,831.7 | 6,706.0 | 7,897.7 | 8,046.8 | 7,890.9 | 6,511.7 | 12,623.6 |
| 2005 | 6,931.9 | 6,094.8 | 5,588.6 | 8,783.8 | 7,956.1 | 6,516.8 | 5,290.9 | 6,503.1 | 6,779.2 | 7,059.9 | 5,404.2 | 8,646.0 |
| 2006 | 6,235.2 | 7,135.5 | 5,899.2 | 7,556.7 | 6,702.9 | 7,232.0 | 5,377.7 | 6,343.4 | 5,839.9 | 5,587.6 | 5,334.6 | 7,413.3 |
| 2007 | 5,937.7 | 5,380.6 | 6,131.6 | 7,159.4 | 7,053.9 | 7,155.4 | 6,599.7 | 7,754.0 | 9,551.7 | 9,090.5 | 10,392.0 | 12,010.1 |
| 2008 | 8,528.7 | 9,273.6 | 9,905.9 | 10,682.2 | 8,730.7 | 7,982.9 | 7,258.0 | 8,428.1 | 7,720.4 | 7,603.0 | 5,206.4 | 7,177.9 |
| 2009 | 6,635.6 | 7,433.4 | 5,113.8 | 6,711.7 | 7,057.0 | 9,506.4 | 6,642.1 | 5,965.3 | 6,609.4 | 7,007.9 | 6,024.7 | 9,291.9 |
| 2010 | 6,302.6 | 7,874.5 | 7,861.2 | 6,402.8 | 6,274.8 | 5,873.8 | 6,443.7 | 7,775.3 | 7,545.7 | 6,836.5 | 8,375.4 | 8,444.0 |
| 2011 | 6,648.4 | 7,909.0 | 7,853.3 | 5,800.2 | 6,048.9 | 6,479.6 | 4,682.7 | 5,710.0 | 5,022.5 | 4,522.1 | 6,284.7 | 8,481.3 |
| 2012 | 5,656.4 | 6,079.3 | 6,115.9 | 5,066.0 | 4,291.8 | 6,057.5 | 4,833.3 | 4,308.2 | 5,122.0 | 4,326.0 | W | 6,064.7 |
| 2013 | 4,970.2 | 4,626.7 | 6,187.8 | 6,323.1 | 5,922.5 | 6,216.4 | 3,493.0 | 2,450.4 | 3,509.9 | 1,207.0 | 1,364.3 | 2,462.7 |
| 2014 | W | W | W | 1,039.9 | W | W | W | W | W | W | W | W |
| 2015 | W | W | 882.8 | W | W | W | W | W | W | W | W | W |
| 2016 | W | W | W | W | W | W | W | W | W | W | W | W |
| 2017 | W | W | W | W | W | W | W | W | W | W | W | W |
| 2018 | W | W | W | 1,252.9 | 1,431.4 | 2,162.3 | 1,954.0 | 2,081.5 | 1,434.9 | 1,743.9 | 1,436.4 | 2,030.5 |
| 2019 | 1,874.3 | W | 561.5 | 541.6 | 809.8 | 1,514.8 | 1,599.3 | 1,693.4 | 958.1 | 821.3 | 497.2 | 1,093.1 |
| 2020 | 673.4 | 866.2 | 610.5 | 746.9 | 853.9 | W | W | W | W | W | W | W |
| 2021 | W | W | W | W | W | W | W | W | W | 447.8 | 514.9 | 507.2 |
| 2022 | 707.7 | 507.3 | 393.0 | |||||||||
| - = No Data Reported; -- = Not Applicable; NA = Not Available; W = Withheld to avoid disclosure of individual company data. |
| Release Date: 6/1/2022 |
| Next Release Date: TBD |