|
Download Data (XLS File) |
|
||||||||
|
||||||||
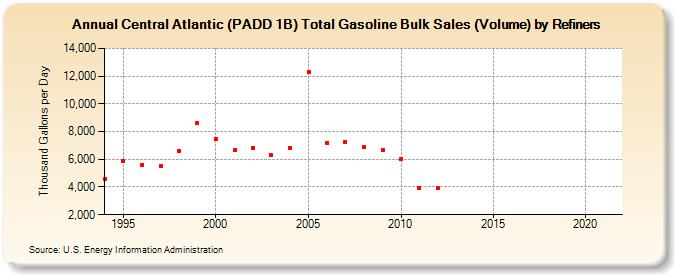
| Central Atlantic (PADD 1B) Total Gasoline Bulk Sales (Volume) by Refiners (Thousand Gallons per Day) | ||||||||
| Decade | Year-0 | Year-1 | Year-2 | Year-3 | Year-4 | Year-5 | Year-6 | Year-7 | Year-8 | Year-9 |
|---|---|---|---|---|---|---|---|---|---|---|
| 1990's | 4,580.5 | 5,862.8 | 5,593.6 | 5,516.7 | 6,593.9 | 8,648.1 | ||||
| 2000's | 7,487.1 | 6,660.1 | 6,839.6 | 6,297.6 | 6,816.2 | 12,312.9 | 7,203.2 | 7,240.7 | 6,904.2 | 6,693.3 |
| 2010's | 5,993.6 | 3,893.6 | 3,938.6 | W | W | W | W | W | W | W |
| 2020's | W |
| - = No Data Reported; -- = Not Applicable; NA = Not Available; W = Withheld to avoid disclosure of individual company data. |
| Release Date: 6/1/2022 |
| Next Release Date: TBD |