|
Download Data (XLS File) |
|
||||||||
|
||||||||
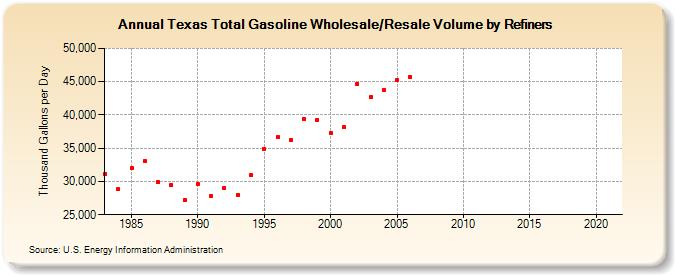
| Texas Total Gasoline Wholesale/Resale Volume by Refiners (Thousand Gallons per Day) | ||||||||
| Decade | Year-0 | Year-1 | Year-2 | Year-3 | Year-4 | Year-5 | Year-6 | Year-7 | Year-8 | Year-9 |
|---|---|---|---|---|---|---|---|---|---|---|
| 1980's | 31,086.9 | 28,805.4 | 31,992.4 | 33,108.6 | 29,899.9 | 29,442.1 | 27,240.5 | |||
| 1990's | 29,601.9 | 27,745.3 | 29,042.5 | 28,004.5 | 30,927.6 | 34,926.1 | 36,661.4 | 36,281.8 | 39,359.8 | 39,283.1 |
| 2000's | 37,300.5 | 38,129.0 | 44,654.4 | 42,634.5 | 43,784.5 | 45,242.4 | 45,728.5 | NA | NA | NA |
| 2010's | NA | NA | NA | NA | NA | NA | NA | NA | NA | NA |
| 2020's | NA |
| - = No Data Reported; -- = Not Applicable; NA = Not Available; W = Withheld to avoid disclosure of individual company data. |
| Release Date: 6/1/2022 |
| Next Release Date: TBD |