|
Download Data (XLS File) |
|
||||||||
|
||||||||
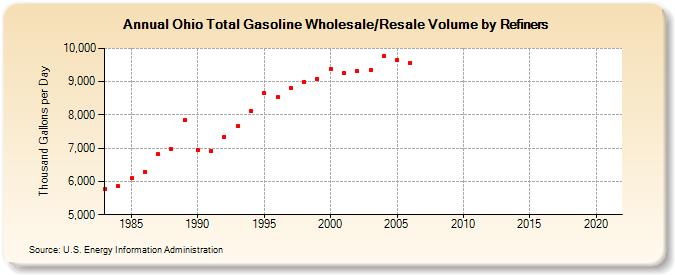
| Ohio Total Gasoline Wholesale/Resale Volume by Refiners (Thousand Gallons per Day) | ||||||||
| Decade | Year-0 | Year-1 | Year-2 | Year-3 | Year-4 | Year-5 | Year-6 | Year-7 | Year-8 | Year-9 |
|---|---|---|---|---|---|---|---|---|---|---|
| 1980's | 5,771.9 | 5,859.2 | 6,091.4 | 6,288.9 | 6,815.8 | 6,984.9 | 7,850.8 | |||
| 1990's | 6,943.9 | 6,917.7 | 7,345.5 | 7,681.3 | 8,103.3 | 8,657.6 | 8,527.9 | 8,801.3 | 8,989.5 | 9,083.2 |
| 2000's | 9,373.9 | 9,245.3 | 9,325.3 | 9,336.8 | 9,773.6 | 9,650.2 | 9,574.2 | NA | NA | NA |
| 2010's | NA | NA | NA | NA | NA | NA | NA | NA | NA | NA |
| 2020's | NA |
| - = No Data Reported; -- = Not Applicable; NA = Not Available; W = Withheld to avoid disclosure of individual company data. |
| Release Date: 6/1/2022 |
| Next Release Date: TBD |