|
Download Data (XLS File) |
|
||||||||
|
||||||||
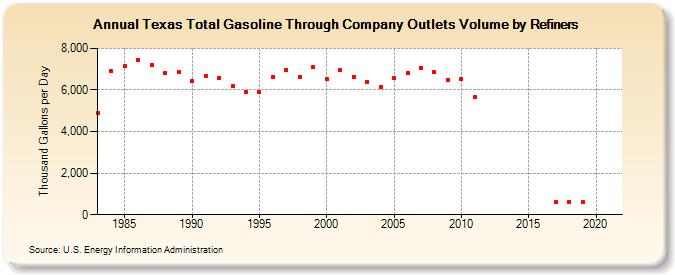
| Texas Total Gasoline Through Company Outlets Volume by Refiners (Thousand Gallons per Day) | ||||||||
| Decade | Year-0 | Year-1 | Year-2 | Year-3 | Year-4 | Year-5 | Year-6 | Year-7 | Year-8 | Year-9 |
|---|---|---|---|---|---|---|---|---|---|---|
| 1980's | 4,901.9 | 6,897.5 | 7,131.1 | 7,424.9 | 7,207.4 | 6,828.2 | 6,864.3 | |||
| 1990's | 6,410.8 | 6,671.3 | 6,589.5 | 6,173.3 | 5,880.6 | 5,893.4 | 6,616.0 | 6,981.4 | 6,640.0 | 7,115.6 |
| 2000's | 6,519.7 | 6,937.1 | 6,633.0 | 6,406.4 | 6,120.3 | 6,597.5 | 6,812.3 | 7,055.7 | 6,849.8 | 6,502.9 |
| 2010's | 6,512.3 | 5,649.5 | W | W | W | W | W | 613.8 | 613.3 | 608.9 |
| 2020's | W |
| - = No Data Reported; -- = Not Applicable; NA = Not Available; W = Withheld to avoid disclosure of individual company data. |
| Release Date: 6/1/2022 |
| Next Release Date: TBD |