|
Download Data (XLS File) |
|
||||||||
|
||||||||
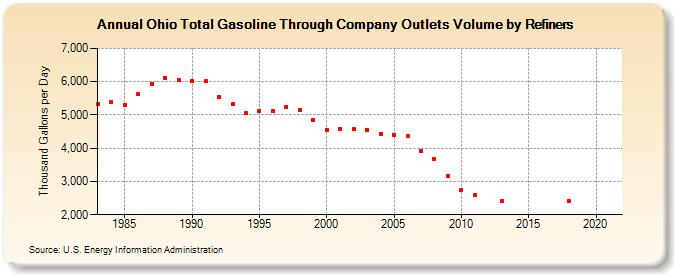
| Ohio Total Gasoline Through Company Outlets Volume by Refiners (Thousand Gallons per Day) | ||||||||
| Decade | Year-0 | Year-1 | Year-2 | Year-3 | Year-4 | Year-5 | Year-6 | Year-7 | Year-8 | Year-9 |
|---|---|---|---|---|---|---|---|---|---|---|
| 1980's | 5,325.7 | 5,388.1 | 5,310.7 | 5,633.3 | 5,942.6 | 6,108.9 | 6,056.4 | |||
| 1990's | 6,010.4 | 6,025.8 | 5,552.0 | 5,316.1 | 5,063.3 | 5,125.1 | 5,129.2 | 5,249.8 | 5,146.2 | 4,835.6 |
| 2000's | 4,549.8 | 4,584.3 | 4,577.4 | 4,540.0 | 4,439.1 | 4,391.7 | 4,374.0 | 3,924.3 | 3,660.9 | 3,157.7 |
| 2010's | 2,738.2 | 2,578.5 | W | 2,421.8 | W | W | W | W | 2,407.1 | W |
| 2020's | W |
| - = No Data Reported; -- = Not Applicable; NA = Not Available; W = Withheld to avoid disclosure of individual company data. |
| Release Date: 6/1/2022 |
| Next Release Date: TBD |