|
Download Data (XLS File) |
|
||||||||
|
||||||||
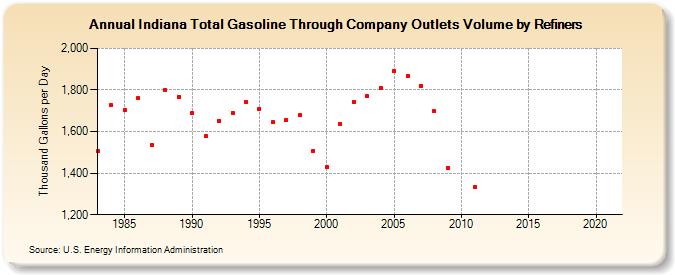
| Indiana Total Gasoline Through Company Outlets Volume by Refiners (Thousand Gallons per Day) | ||||||||
| Decade | Year-0 | Year-1 | Year-2 | Year-3 | Year-4 | Year-5 | Year-6 | Year-7 | Year-8 | Year-9 |
|---|---|---|---|---|---|---|---|---|---|---|
| 1980's | 1,504.9 | 1,727.7 | 1,702.5 | 1,759.8 | 1,535.7 | 1,800.2 | 1,768.1 | |||
| 1990's | 1,687.0 | 1,577.5 | 1,652.0 | 1,690.1 | 1,742.8 | 1,710.1 | 1,644.6 | 1,656.6 | 1,679.5 | 1,508.6 |
| 2000's | 1,429.8 | 1,638.2 | 1,744.0 | 1,769.1 | 1,808.7 | 1,889.3 | 1,866.0 | 1,821.2 | 1,696.8 | 1,425.0 |
| 2010's | W | 1,335.1 | W | W | W | W | W | W | W | W |
| 2020's | W |
| - = No Data Reported; -- = Not Applicable; NA = Not Available; W = Withheld to avoid disclosure of individual company data. |
| Release Date: 6/1/2022 |
| Next Release Date: TBD |