|
Download Data (XLS File) |
|
||||||||
|
||||||||
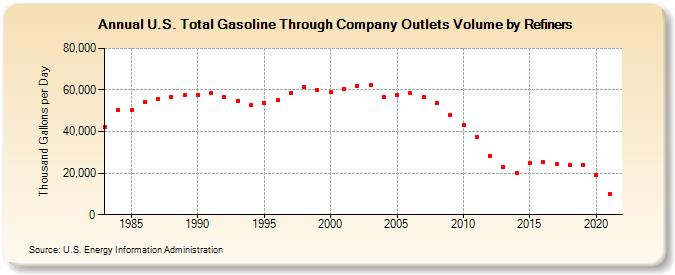
| U.S. Total Gasoline Through Company Outlets Volume by Refiners (Thousand Gallons per Day) | ||||||||
| Decade | Year-0 | Year-1 | Year-2 | Year-3 | Year-4 | Year-5 | Year-6 | Year-7 | Year-8 | Year-9 |
|---|---|---|---|---|---|---|---|---|---|---|
| 1980's | 42,275.0 | 50,320.6 | 50,506.2 | 54,242.5 | 55,696.3 | 56,669.2 | 57,475.0 | |||
| 1990's | 57,379.6 | 58,437.0 | 56,598.0 | 54,910.4 | 52,764.9 | 53,713.9 | 55,111.2 | 58,651.5 | 61,441.2 | 60,172.5 |
| 2000's | 59,124.6 | 60,400.0 | 62,090.7 | 62,218.8 | 56,851.1 | 57,546.8 | 58,563.6 | 56,659.4 | 53,879.2 | 47,969.1 |
| 2010's | 43,083.2 | 37,534.7 | 28,037.9 | 23,021.9 | 19,926.2 | 25,113.9 | 25,338.3 | 24,232.0 | 23,938.2 | 23,849.8 |
| 2020's | 19,107.1 |
| - = No Data Reported; -- = Not Applicable; NA = Not Available; W = Withheld to avoid disclosure of individual company data. |
| Release Date: 6/1/2022 |
| Next Release Date: TBD |