|
Download Data (XLS File) |
|
||||||||
|
||||||||
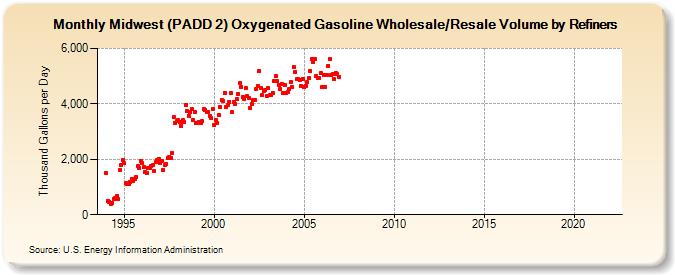
| Midwest (PADD 2) Oxygenated Gasoline Wholesale/Resale Volume by Refiners (Thousand Gallons per Day) | ||||||||
| Year | Jan | Feb | Mar | Apr | May | Jun | Jul | Aug | Sep | Oct | Nov | Dec |
|---|---|---|---|---|---|---|---|---|---|---|---|---|
| 1994 | 1,511.4 | 506.5 | 472.8 | 396.9 | 418.1 | 562.2 | 593.1 | 669.5 | 560.6 | 1,620.5 | 1,806.5 | 1,961.5 |
| 1995 | 1,853.0 | 1,131.8 | 1,108.8 | 1,124.6 | 1,194.8 | 1,292.6 | 1,225.9 | 1,283.0 | 1,357.1 | 1,764.5 | 1,699.4 | 1,951.3 |
| 1996 | 1,861.4 | 1,706.4 | 1,523.5 | 1,506.9 | 1,668.6 | 1,681.4 | 1,755.8 | 1,798.0 | 1,586.8 | 1,894.9 | 1,962.3 | 2,014.6 |
| 1997 | 1,876.4 | 1,929.0 | 1,612.2 | 1,792.9 | 1,825.7 | 2,029.8 | 2,082.4 | 2,043.3 | 2,220.4 | 3,520.9 | 3,324.9 | 3,368.0 |
| 1998 | 3,416.6 | 3,347.3 | 3,212.8 | 3,416.5 | 3,352.8 | 3,960.5 | 3,740.7 | 3,577.3 | 3,694.4 | 3,801.2 | 3,434.5 | 3,691.4 |
| 1999 | 3,299.9 | 3,299.3 | 3,360.1 | 3,313.2 | 3,371.9 | 3,811.2 | 3,788.8 | 3,688.7 | 3,712.8 | 3,578.2 | 3,488.1 | 3,823.5 |
| 2000 | 3,245.2 | 3,429.8 | 3,314.5 | 3,600.7 | 3,896.7 | 4,124.0 | 4,103.2 | 4,403.8 | 3,892.4 | 3,946.4 | 4,082.7 | 4,395.5 |
| 2001 | 3,691.9 | 4,049.9 | 3,982.0 | 4,170.6 | 4,364.9 | 4,740.7 | 4,621.4 | 4,240.8 | 4,174.4 | 4,556.9 | 4,271.5 | 4,227.4 |
| 2002 | 3,853.8 | 4,002.3 | 4,135.7 | 4,150.4 | 4,526.7 | 4,656.1 | 5,196.9 | 4,577.8 | 4,303.9 | 4,480.3 | 4,505.6 | 4,289.2 |
| 2003 | 4,556.0 | 4,302.9 | 4,326.6 | 4,396.3 | 4,839.1 | 4,987.6 | 4,819.1 | 4,691.2 | 4,547.3 | 4,715.8 | 4,394.4 | 4,664.7 |
| 2004 | 4,389.6 | 4,431.6 | 4,537.4 | 4,772.7 | 4,613.0 | 5,344.4 | 5,154.9 | 4,882.5 | 4,893.9 | 4,842.6 | 4,649.1 | 4,904.8 |
| 2005 | 4,590.7 | 4,658.1 | 4,783.9 | 4,932.6 | 5,171.9 | 5,627.3 | 5,525.6 | 5,629.3 | 5,001.9 | 4,949.0 | 4,923.3 | 5,111.4 |
| 2006 | 4,596.3 | 5,045.8 | 4,612.4 | 5,040.3 | 5,376.9 | 5,612.6 | 5,039.9 | 5,069.1 | 4,910.2 | 5,126.1 | 5,074.0 | 4,983.5 |
| 2007 | - | - | - | - | - | - | - | - | - | - | - | - |
| 2008 | - | - | - | - | - | - | - | - | - | - | - | - |
| 2009 | - | - | - | - | - | - | - | - | - | - | - | - |
| 2010 | - | - | - | - | - | - | - | - | - | - | - | - |
| 2011 | - | - | - | - | - | - | - | - | - | - | - | - |
| 2012 | - | - | - | - | - | - | - | - | - | - | - | - |
| 2013 | - | - | - | - | - | - | - | - | - | - | - | - |
| 2014 | - | - | - | - | - | - | - | - | - | - | - | - |
| 2015 | - | - | - | - | - | - | - | - | - | - | - | - |
| 2016 | - | - | - | - | - | - | - | - | - | - | - | - |
| 2017 | - | - | - | - | - | - | - | - | - | - | - | - |
| 2018 | - | - | - | - | - | - | - | - | - | - | - | - |
| 2019 | - | - | - | - | - | - | - | - | - | - | - | - |
| 2020 | - | - | - | - | - | - | - | - | - | - | - | - |
| 2021 | - | - | - | - | - | - | - | - | - | - | - | - |
| 2022 | - | - | - | |||||||||
| - = No Data Reported; -- = Not Applicable; NA = Not Available; W = Withheld to avoid disclosure of individual company data. |
| Release Date: 6/1/2022 |
| Next Release Date: TBD |