|
Download Data (XLS File) |
|
||||||||
|
||||||||
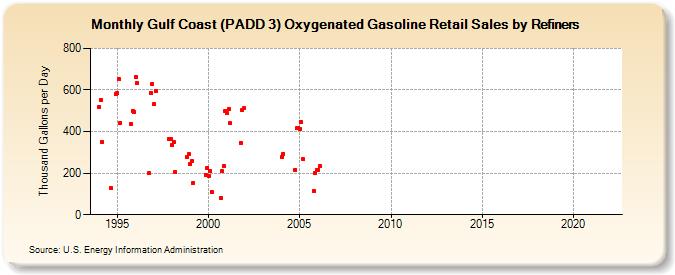
| Gulf Coast (PADD 3) Oxygenated Gasoline Retail Sales by Refiners (Thousand Gallons per Day) | ||||||||
| Year | Jan | Feb | Mar | Apr | May | Jun | Jul | Aug | Sep | Oct | Nov | Dec |
|---|---|---|---|---|---|---|---|---|---|---|---|---|
| 1994 | 519.7 | 553.8 | 352.0 | W | W | W | W | W | 126.4 | W | W | 579.7 |
| 1995 | 585.0 | 651.0 | 441.9 | W | W | W | W | W | W | 438.3 | 500.6 | 496.3 |
| 1996 | 660.1 | 632.6 | W | W | W | W | W | W | W | 198.3 | 587.1 | 628.7 |
| 1997 | 531.3 | 594.9 | W | W | W | W | W | W | W | W | 364.1 | 363.2 |
| 1998 | 336.9 | 347.9 | 205.6 | W | W | W | W | - | W | W | 275.4 | 291.3 |
| 1999 | 242.2 | 256.0 | 152.8 | W | W | W | W | W | W | W | 192.0 | 224.9 |
| 2000 | 188.3 | 209.2 | 110.3 | W | W | W | W | W | 80.9 | 207.9 | 232.7 | 499.6 |
| 2001 | 490.1 | 508.2 | 439.0 | W | W | W | W | W | W | 346.2 | 502.4 | 512.0 |
| 2002 | W | W | W | W | W | W | W | W | W | W | W | W |
| 2003 | W | W | W | W | W | W | W | W | W | W | W | W |
| 2004 | 276.9 | 293.6 | W | W | W | W | W | W | W | 217.4 | 415.6 | 419.3 |
| 2005 | 413.3 | 444.9 | 265.7 | W | W | W | W | W | W | 113.2 | 202.5 | 214.2 |
| 2006 | 216.3 | 233.1 | W | W | W | W | W | W | W | W | W | W |
| 2007 | - | - | - | - | - | - | - | - | - | - | - | - |
| 2008 | - | - | - | - | - | - | - | - | - | - | - | - |
| 2009 | - | - | - | - | - | - | - | - | - | - | - | - |
| 2010 | - | - | - | - | - | - | - | - | - | - | - | - |
| 2011 | - | - | - | - | - | - | - | - | - | - | - | - |
| 2012 | - | - | - | - | - | - | - | - | - | - | - | - |
| 2013 | - | - | - | - | - | - | - | - | - | - | - | - |
| 2014 | - | - | - | - | - | - | - | - | - | - | - | - |
| 2015 | - | - | - | - | - | - | - | - | - | - | - | - |
| 2016 | - | - | - | - | - | - | - | - | - | - | - | - |
| 2017 | - | - | - | - | - | - | - | - | - | - | - | - |
| 2018 | - | - | - | - | - | - | - | - | - | - | - | - |
| 2019 | - | - | - | - | - | - | - | - | - | - | - | - |
| 2020 | - | - | - | - | - | - | - | - | - | - | - | - |
| 2021 | - | - | - | - | - | - | - | - | - | - | - | - |
| 2022 | - | - | - | |||||||||
| - = No Data Reported; -- = Not Applicable; NA = Not Available; W = Withheld to avoid disclosure of individual company data. |
| Release Date: 6/1/2022 |
| Next Release Date: TBD |