|
Download Data (XLS File) |
|
||||||||
|
||||||||
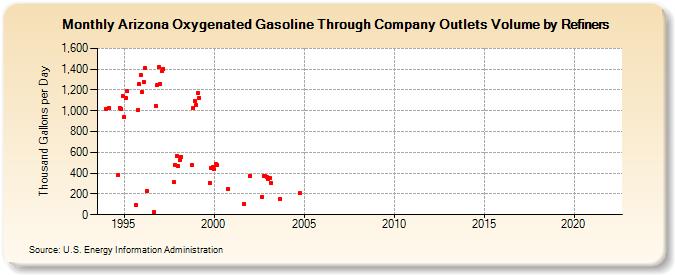
| Arizona Oxygenated Gasoline Through Company Outlets Volume by Refiners (Thousand Gallons per Day) | ||||||||
| Year | Jan | Feb | Mar | Apr | May | Jun | Jul | Aug | Sep | Oct | Nov | Dec |
|---|---|---|---|---|---|---|---|---|---|---|---|---|
| 1994 | 1,021.6 | W | 1,029.5 | W | W | W | W | W | 381.2 | 1,030.3 | 1,021.3 | 1,138.2 |
| 1995 | 939.4 | 1,124.3 | 1,189.6 | W | W | W | W | W | 94.1 | 1,010.0 | 1,255.8 | 1,347.6 |
| 1996 | 1,178.8 | 1,279.4 | 1,412.2 | 226.8 | W | - | - | W | 23.4 | 1,049.0 | 1,243.8 | 1,417.1 |
| 1997 | 1,260.9 | 1,380.8 | 1,406.5 | W | W | W | W | W | W | 313.4 | 478.3 | 567.2 |
| 1998 | 464.1 | 525.1 | 559.6 | W | - | - | - | - | W | 479.8 | 1,022.0 | 1,092.9 |
| 1999 | 1,057.5 | 1,171.1 | 1,123.7 | W | W | W | W | W | W | 305.8 | 448.2 | 459.7 |
| 2000 | 435.3 | 485.6 | 475.9 | - | - | - | - | - | W | 249.7 | W | W |
| 2001 | W | W | W | W | - | - | - | - | 103.9 | W | W | W |
| 2002 | 376.9 | W | W | - | - | - | - | - | 175.2 | 372.5 | 370.1 | 359.3 |
| 2003 | 346.7 | 348.6 | 308.0 | - | - | - | - | - | 149.3 | W | W | W |
| 2004 | W | W | W | W | - | - | - | - | W | 210.0 | W | W |
| 2005 | W | W | W | - | - | - | - | - | W | W | W | W |
| 2006 | W | W | W | - | - | - | - | - | - | W | W | W |
| 2007 | - | - | - | - | - | - | - | - | - | - | - | - |
| 2008 | - | - | - | - | - | - | - | - | - | - | - | - |
| 2009 | - | - | - | - | - | - | - | - | - | - | - | - |
| 2010 | - | - | - | - | - | - | - | - | - | - | - | - |
| 2011 | - | - | - | - | - | - | - | - | - | - | - | - |
| 2012 | - | - | - | - | - | - | - | - | - | - | - | - |
| 2013 | - | - | - | - | - | - | - | - | - | - | - | - |
| 2014 | - | - | - | - | - | - | - | - | - | - | - | - |
| 2015 | - | - | - | - | - | - | - | - | - | - | - | - |
| 2016 | - | - | - | - | - | - | - | - | - | - | - | - |
| 2017 | - | - | - | - | - | - | - | - | - | - | - | - |
| 2018 | - | - | - | - | - | - | - | - | - | - | - | - |
| 2019 | - | - | - | - | - | - | - | - | - | - | - | - |
| 2020 | - | - | - | - | - | - | - | - | - | - | - | - |
| 2021 | - | - | - | - | - | - | - | - | - | - | - | - |
| 2022 | - | - | - | |||||||||
| - = No Data Reported; -- = Not Applicable; NA = Not Available; W = Withheld to avoid disclosure of individual company data. |
| Release Date: 6/1/2022 |
| Next Release Date: TBD |