|
Download Data (XLS File) |
|
||||||||
|
||||||||
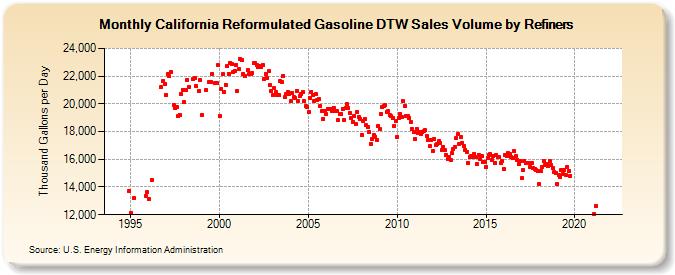
| California Reformulated Gasoline DTW Sales Volume by Refiners (Thousand Gallons per Day) | ||||||||
| Year | Jan | Feb | Mar | Apr | May | Jun | Jul | Aug | Sep | Oct | Nov | Dec |
|---|---|---|---|---|---|---|---|---|---|---|---|---|
| 1994 | - | - | - | - | - | - | - | - | - | - | W | 13,706.3 |
| 1995 | 12,143.5 | W | 13,197.5 | W | W | W | W | W | W | W | 13,379.7 | 13,619.0 |
| 1996 | 13,115.0 | W | 14,502.5 | W | W | W | W | W | 21,192.7 | W | 21,616.7 | 21,463.6 |
| 1997 | 20,629.7 | 22,136.8 | 21,990.0 | 22,310.6 | W | 19,914.1 | 19,687.8 | 19,785.7 | 19,091.7 | 19,220.1 | 20,690.5 | 21,008.3 |
| 1998 | 20,108.1 | 20,962.1 | 21,735.6 | 21,224.6 | W | W | 21,768.7 | 21,893.6 | 21,312.4 | W | 20,909.7 | 21,712.2 |
| 1999 | 19,194.8 | W | W | 20,998.8 | W | 21,587.1 | 21,595.2 | 22,137.5 | W | 21,522.5 | 21,477.5 | 22,775.5 |
| 2000 | 19,132.8 | 21,101.5 | 22,126.6 | 20,863.3 | 21,365.1 | 22,701.6 | 22,177.4 | 22,946.6 | 22,859.8 | 22,270.3 | 22,387.7 | 22,827.4 |
| 2001 | 20,933.2 | 22,481.0 | 23,259.2 | 23,150.5 | 22,187.5 | 21,981.3 | W | 22,405.9 | 22,134.3 | 22,130.9 | 22,212.5 | 22,937.6 |
| 2002 | 22,939.6 | 22,790.8 | 22,676.6 | 22,701.9 | 22,688.2 | 22,825.2 | 21,808.4 | 22,141.9 | 21,850.8 | 22,337.6 | 21,349.3 | 20,919.6 |
| 2003 | 20,604.5 | 21,112.3 | 20,821.3 | 20,614.4 | 20,616.6 | 21,613.5 | 21,576.9 | 22,041.3 | 20,466.1 | 20,713.7 | 20,839.2 | 20,744.8 |
| 2004 | 20,177.1 | 20,790.1 | 20,480.5 | 20,430.8 | 20,913.1 | 20,193.1 | 20,558.3 | 20,730.4 | 20,835.5 | 20,179.0 | 19,808.0 | 19,776.5 |
| 2005 | 19,418.2 | 20,441.6 | 20,879.6 | 20,665.4 | 20,237.8 | 20,711.1 | 20,242.4 | 20,336.0 | 19,845.2 | 19,474.7 | 18,922.6 | 19,477.2 |
| 2006 | 19,235.7 | 19,660.2 | 19,643.2 | 19,610.8 | 19,486.0 | 19,728.1 | 19,513.0 | 19,490.2 | 18,806.4 | 19,263.1 | 19,242.4 | 19,653.2 |
| 2007 | 18,862.4 | 19,714.8 | 19,985.9 | 19,703.4 | 19,329.0 | 18,991.2 | 18,713.1 | 19,089.8 | 18,572.4 | 19,436.2 | 19,020.8 | 18,908.7 |
| 2008 | 17,763.7 | 18,760.6 | 18,926.0 | 18,446.1 | 18,360.7 | 17,979.9 | 17,127.1 | 17,455.0 | 17,743.0 | 17,633.3 | 17,358.2 | 18,417.2 |
| 2009 | 18,177.8 | 19,272.6 | 19,757.4 | 19,852.2 | 19,904.9 | 19,417.8 | 19,453.4 | 19,200.3 | 19,099.6 | 18,949.7 | 18,413.0 | 18,774.2 |
| 2010 | 17,630.2 | 19,001.9 | 19,266.7 | 19,048.0 | 20,178.3 | 19,836.4 | 19,105.8 | 19,126.2 | 18,982.6 | 18,711.6 | 18,204.6 | 17,958.2 |
| 2011 | 17,459.6 | 18,213.3 | 17,906.5 | 17,984.7 | 17,828.8 | 17,955.2 | 18,007.6 | 18,083.3 | 17,645.9 | 17,398.1 | 16,921.9 | 17,406.6 |
| 2012 | 16,598.1 | 17,486.4 | 17,020.4 | 17,096.4 | 17,283.3 | 17,181.6 | 16,666.1 | 16,907.5 | 16,660.6 | 16,303.1 | 16,011.5 | 16,186.1 |
| 2013 | 15,944.7 | 16,431.4 | 16,739.9 | 16,919.4 | 17,544.6 | 17,795.8 | 17,114.0 | 17,634.3 | 17,166.0 | 16,971.6 | 16,703.7 | 16,544.9 |
| 2014 | 15,760.3 | 16,142.5 | 16,211.9 | 16,137.9 | 16,388.1 | 16,145.5 | 15,675.1 | 16,295.5 | 16,000.9 | 16,232.1 | 15,836.3 | 15,826.5 |
| 2015 | 15,475.9 | 16,122.3 | 16,289.9 | 16,354.6 | 15,929.5 | 16,219.1 | 15,738.5 | 16,301.4 | 16,183.2 | 16,133.9 | 15,727.9 | 15,877.2 |
| 2016 | 15,301.4 | 16,305.9 | 16,244.4 | 16,452.8 | 16,404.2 | 16,184.7 | 16,105.9 | 16,591.2 | 16,233.4 | 15,973.7 | 15,638.6 | 15,875.5 |
| 2017 | 14,622.6 | 15,244.7 | 15,880.0 | 15,710.3 | 15,706.1 | 15,703.1 | 15,466.1 | 15,749.0 | 15,398.9 | 15,324.2 | 15,229.5 | 15,135.9 |
| 2018 | 14,193.4 | 15,149.8 | 15,432.1 | 15,878.6 | 15,596.3 | 15,650.6 | 15,517.8 | 15,892.8 | 15,620.2 | 15,377.8 | 15,065.4 | 15,042.0 |
| 2019 | 14,245.6 | 14,840.4 | 14,745.8 | 15,219.1 | 14,966.5 | 15,251.0 | 14,846.3 | 15,445.2 | 15,184.7 | 14,818.8 | W | W |
| 2020 | W | W | W | W | W | W | W | W | W | W | W | W |
| 2021 | W | 12,039.0 | 12,642.5 | W | W | W | W | W | W | W | W | W |
| 2022 | W | W | W | |||||||||
| - = No Data Reported; -- = Not Applicable; NA = Not Available; W = Withheld to avoid disclosure of individual company data. |
| Release Date: 6/1/2022 |
| Next Release Date: TBD |