|
Download Data (XLS File) |
|
||||||||
|
||||||||
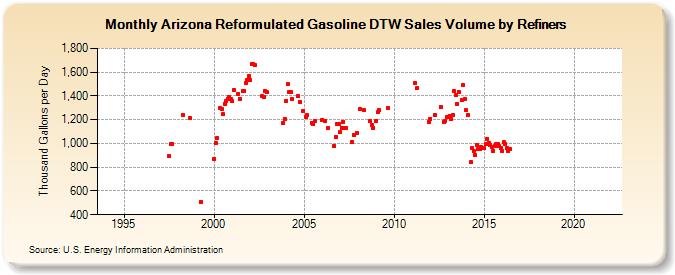
| Arizona Reformulated Gasoline DTW Sales Volume by Refiners (Thousand Gallons per Day) | ||||||||
| Year | Jan | Feb | Mar | Apr | May | Jun | Jul | Aug | Sep | Oct | Nov | Dec |
|---|---|---|---|---|---|---|---|---|---|---|---|---|
| 1994 | - | - | - | - | - | - | - | - | - | - | - | - |
| 1995 | - | - | - | - | - | - | - | - | - | - | - | - |
| 1996 | - | - | - | - | - | - | - | - | - | - | - | - |
| 1997 | - | - | - | - | - | W | 891.8 | 994.8 | 998.3 | W | W | W |
| 1998 | W | W | W | 1,242.3 | W | W | W | W | 1,212.7 | W | W | W |
| 1999 | W | W | W | 511.0 | W | W | W | W | W | W | W | W |
| 2000 | 872.5 | 1,001.8 | 1,045.4 | W | 1,298.2 | 1,289.6 | 1,244.1 | 1,334.1 | 1,361.1 | 1,378.2 | 1,389.7 | 1,371.4 |
| 2001 | 1,356.7 | 1,451.5 | W | W | 1,418.4 | 1,378.1 | W | 1,443.2 | 1,441.4 | 1,511.8 | 1,530.3 | 1,566.4 |
| 2002 | 1,530.5 | 1,665.3 | 1,668.7 | 1,657.7 | W | W | W | W | 1,398.4 | 1,389.5 | 1,444.5 | 1,430.2 |
| 2003 | W | W | W | W | W | W | W | W | W | W | 1,173.3 | 1,206.9 |
| 2004 | 1,355.5 | 1,496.5 | 1,433.2 | 1,430.0 | 1,376.6 | W | W | W | 1,395.7 | 1,350.9 | W | 1,273.5 |
| 2005 | W | 1,218.8 | 1,237.1 | W | W | 1,175.0 | 1,163.0 | 1,187.7 | W | W | W | W |
| 2006 | 1,198.7 | W | 1,190.8 | W | 1,132.6 | W | W | W | 982.4 | 1,053.0 | 1,164.2 | 1,162.2 |
| 2007 | 1,096.6 | 1,131.6 | 1,183.6 | 1,126.0 | 1,129.6 | W | W | W | 1,012.5 | 1,073.5 | W | 1,089.9 |
| 2008 | W | 1,288.8 | W | W | 1,278.1 | W | W | W | 1,191.2 | 1,159.1 | 1,133.8 | W |
| 2009 | 1,187.6 | 1,261.8 | 1,278.5 | W | W | W | W | W | 1,294.7 | W | W | W |
| 2010 | W | W | W | W | W | W | W | NA | NA | W | W | W |
| 2011 | W | W | 1,504.8 | 1,464.0 | W | W | W | W | W | W | W | 1,183.4 |
| 2012 | 1,207.5 | W | W | 1,240.9 | W | W | W | 1,309.2 | W | 1,179.2 | 1,186.3 | 1,226.0 |
| 2013 | 1,219.6 | 1,234.3 | 1,209.4 | 1,239.1 | 1,437.7 | 1,410.3 | 1,333.5 | 1,435.8 | W | 1,369.1 | 1,488.7 | 1,377.6 |
| 2014 | 1,277.4 | 1,242.2 | W | 840.3 | 961.9 | 936.1 | 905.0 | 985.8 | 950.6 | 954.7 | 970.9 | 960.6 |
| 2015 | 962.2 | 995.2 | 1,037.5 | 1,003.7 | 984.5 | 973.0 | 939.0 | 980.9 | 993.2 | 998.6 | 978.1 | 960.7 |
| 2016 | 939.4 | 1,008.0 | 997.7 | 958.1 | 932.2 | 951.7 | W | W | W | W | W | W |
| 2017 | W | W | W | W | W | W | W | W | W | W | W | W |
| 2018 | W | W | W | W | W | W | W | W | W | W | W | W |
| 2019 | W | W | W | W | W | W | W | W | W | W | W | W |
| 2020 | W | W | W | W | W | W | W | W | W | W | W | W |
| 2021 | W | W | W | W | W | W | W | W | W | W | W | W |
| 2022 | W | W | W | |||||||||
| - = No Data Reported; -- = Not Applicable; NA = Not Available; W = Withheld to avoid disclosure of individual company data. |
| Release Date: 6/1/2022 |
| Next Release Date: TBD |