|
Download Data (XLS File) |
|
||||||||
|
||||||||
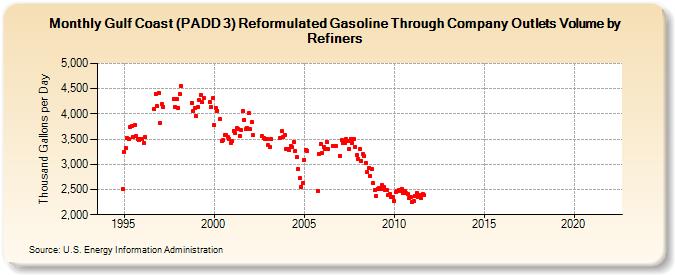
| Gulf Coast (PADD 3) Reformulated Gasoline Through Company Outlets Volume by Refiners (Thousand Gallons per Day) | ||||||||
| Year | Jan | Feb | Mar | Apr | May | Jun | Jul | Aug | Sep | Oct | Nov | Dec |
|---|---|---|---|---|---|---|---|---|---|---|---|---|
| 1994 | - | - | - | - | - | - | - | - | - | - | W | 2,517.1 |
| 1995 | 3,252.2 | 3,327.4 | 3,524.0 | 3,496.5 | 3,747.3 | 3,762.2 | 3,548.4 | 3,778.0 | 3,552.4 | 3,503.5 | 3,478.1 | 3,510.3 |
| 1996 | 3,494.6 | 3,419.5 | 3,548.4 | W | W | W | W | W | 4,103.9 | 4,397.2 | 4,148.4 | 4,422.7 |
| 1997 | 3,819.6 | 4,195.3 | 4,142.0 | W | W | W | W | W | W | 4,300.0 | 4,143.5 | 4,293.6 |
| 1998 | 4,115.3 | 4,391.3 | 4,547.0 | W | W | W | W | W | W | 4,219.8 | 4,061.1 | 4,107.4 |
| 1999 | 3,951.0 | 4,129.2 | 4,280.5 | 4,382.4 | 4,228.7 | 4,310.1 | W | W | W | 4,233.6 | 4,135.6 | 4,309.2 |
| 2000 | 3,776.1 | 4,117.7 | 4,063.8 | W | 3,892.3 | 3,469.9 | 3,474.0 | 3,576.5 | 3,583.7 | 3,537.0 | 3,506.2 | 3,428.1 |
| 2001 | 3,453.4 | 3,670.1 | 3,615.7 | 3,714.0 | 3,700.5 | 3,564.4 | 3,671.4 | 4,060.6 | 3,881.7 | 3,695.9 | 3,716.0 | 4,015.3 |
| 2002 | 3,694.9 | 3,831.3 | 3,574.1 | W | W | W | W | W | 3,556.1 | 3,520.7 | 3,492.7 | 3,497.0 |
| 2003 | 3,376.0 | 3,351.1 | 3,498.9 | W | W | W | W | W | 3,526.2 | 3,659.3 | 3,544.3 | 3,579.7 |
| 2004 | 3,300.8 | 3,302.9 | 3,286.7 | 3,364.2 | 3,336.2 | 3,447.3 | 3,269.0 | 3,146.8 | 2,900.2 | 2,723.2 | 2,555.7 | 2,623.1 |
| 2005 | 3,089.0 | 3,290.9 | 3,273.4 | W | W | W | W | W | W | 2,475.9 | 3,211.5 | 3,403.2 |
| 2006 | 3,226.0 | 3,346.1 | 3,307.9 | 3,443.5 | 3,296.8 | W | W | 3,368.7 | 3,370.3 | 3,366.5 | W | W |
| 2007 | 3,167.2 | 3,477.1 | 3,414.7 | 3,428.5 | 3,501.2 | 3,457.2 | 3,304.6 | 3,508.0 | 3,431.0 | 3,494.7 | 3,350.7 | 3,175.0 |
| 2008 | 3,105.1 | 3,310.6 | 3,072.0 | 3,197.9 | 3,162.8 | 3,031.8 | 2,838.6 | 2,923.2 | 2,767.2 | 2,903.6 | 2,623.0 | 2,491.7 |
| 2009 | 2,369.5 | 2,518.2 | 2,529.1 | 2,502.0 | 2,586.8 | 2,554.4 | 2,498.2 | 2,498.1 | 2,382.3 | 2,410.8 | 2,353.0 | 2,344.5 |
| 2010 | 2,274.5 | 2,444.0 | 2,474.5 | 2,484.8 | 2,469.5 | 2,518.7 | 2,439.9 | 2,479.4 | 2,430.2 | 2,413.6 | 2,325.6 | 2,353.3 |
| 2011 | 2,249.0 | 2,262.9 | 2,377.9 | 2,428.8 | 2,361.3 | 2,393.7 | 2,331.9 | 2,411.9 | 2,386.8 | W | W | W |
| 2012 | W | W | W | W | W | W | W | W | W | W | W | W |
| 2013 | W | W | W | W | - | - | - | - | - | - | - | - |
| 2014 | - | - | - | - | - | - | - | - | - | - | - | - |
| 2015 | - | - | - | - | - | - | - | - | - | - | - | - |
| 2016 | - | - | - | - | - | - | - | - | - | - | - | - |
| 2017 | - | - | - | - | - | - | - | - | - | - | - | - |
| 2018 | - | - | - | - | - | - | - | - | - | - | - | - |
| 2019 | - | - | - | - | - | - | - | W | W | W | W | W |
| 2020 | W | W | W | W | W | W | W | W | W | W | W | W |
| 2021 | W | W | W | W | W | - | - | - | - | - | - | - |
| 2022 | - | - | - | |||||||||
| - = No Data Reported; -- = Not Applicable; NA = Not Available; W = Withheld to avoid disclosure of individual company data. |
| Release Date: 6/1/2022 |
| Next Release Date: TBD |