|
Download Data (XLS File) |
|
|||||
|
|||||
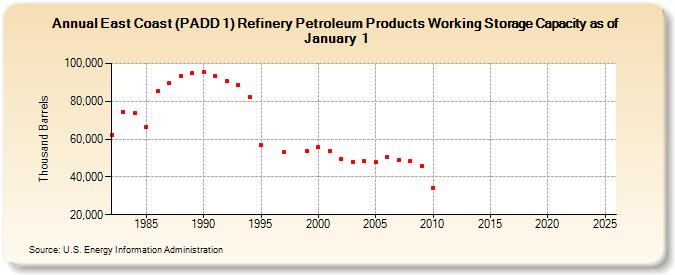
| East Coast (PADD 1) Refinery Petroleum Products Working Storage Capacity as of January 1 (Thousand Barrels) | |||||
| Decade | Year-0 | Year-1 | Year-2 | Year-3 | Year-4 | Year-5 | Year-6 | Year-7 | Year-8 | Year-9 |
|---|---|---|---|---|---|---|---|---|---|---|
| 1980's | 62,275 | 74,564 | 73,818 | 66,652 | 85,312 | 89,528 | 93,392 | 94,769 | ||
| 1990's | 95,530 | 93,189 | 90,804 | 88,542 | 82,172 | 56,757 | NA | 53,162 | NA | 53,941 |
| 2000's | 55,663 | 53,630 | 49,580 | 47,946 | 48,477 | 47,839 | 50,469 | 48,907 | 48,369 | 45,809 |
| 2010's | 34,265 | -- | -- | -- | -- | -- | -- | -- | -- | -- |
| 2020's | -- | -- | -- | -- |
| - = No Data Reported; -- = Not Applicable; NA = Not Available; W = Withheld to avoid disclosure of individual company data. |
| Release Date: 6/21/2022 |
| Next Release Date: June 2024 |