|
Download Data (XLS File) |
|
|||||
|
|||||
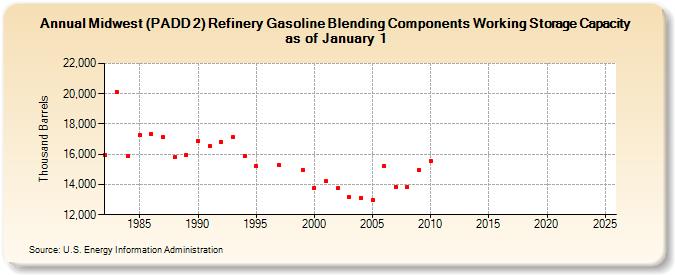
| Midwest (PADD 2) Refinery Gasoline Blending Components Working Storage Capacity as of January 1 (Thousand Barrels) | |||||
| Decade | Year-0 | Year-1 | Year-2 | Year-3 | Year-4 | Year-5 | Year-6 | Year-7 | Year-8 | Year-9 |
|---|---|---|---|---|---|---|---|---|---|---|
| 1980's | 15,971 | 20,139 | 15,867 | 17,250 | 17,363 | 17,111 | 15,787 | 15,968 | ||
| 1990's | 16,867 | 16,560 | 16,794 | 17,114 | 15,863 | 15,200 | NA | 15,266 | NA | 14,979 |
| 2000's | 13,770 | 14,197 | 13,737 | 13,147 | 13,133 | 12,941 | 15,197 | 13,861 | 13,816 | 14,960 |
| 2010's | 15,566 | -- | -- | -- | -- | -- | -- | -- | -- | -- |
| 2020's | -- | -- | -- | -- | -- |
| - = No Data Reported; -- = Not Applicable; NA = Not Available; W = Withheld to avoid disclosure of individual company data. |
| Release Date: 6/14/2024 |
| Next Release Date: June 2025 |