|
Download Data (XLS File) |
|
|||||
|
|||||
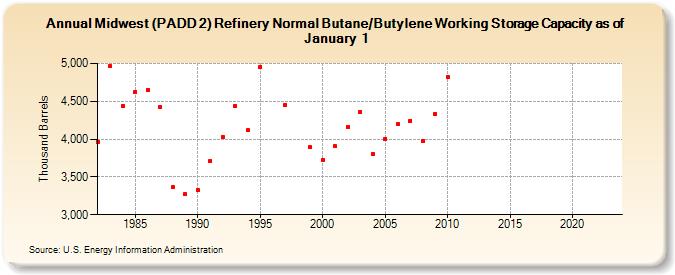
| Midwest (PADD 2) Refinery Normal Butane/Butylene Working Storage Capacity as of January 1 (Thousand Barrels) | |||||
| Decade | Year-0 | Year-1 | Year-2 | Year-3 | Year-4 | Year-5 | Year-6 | Year-7 | Year-8 | Year-9 |
|---|---|---|---|---|---|---|---|---|---|---|
| 1980's | 3,965 | 4,967 | 4,442 | 4,624 | 4,653 | 4,422 | 3,365 | 3,268 | ||
| 1990's | 3,324 | 3,713 | 4,031 | 4,436 | 4,120 | 4,958 | NA | 4,451 | NA | 3,895 |
| 2000's | 3,724 | 3,904 | 4,164 | 4,362 | 3,802 | 4,002 | 4,195 | 4,244 | 3,981 | 4,337 |
| 2010's | 4,821 | -- | -- | -- | -- | -- | -- | -- | -- | -- |
| 2020's | -- | -- | -- | -- |
| - = No Data Reported; -- = Not Applicable; NA = Not Available; W = Withheld to avoid disclosure of individual company data. |
| Release Date: 6/21/2022 |
| Next Release Date: June 2024 |