|
Download Data (XLS File) |
|
|||||
|
|||||
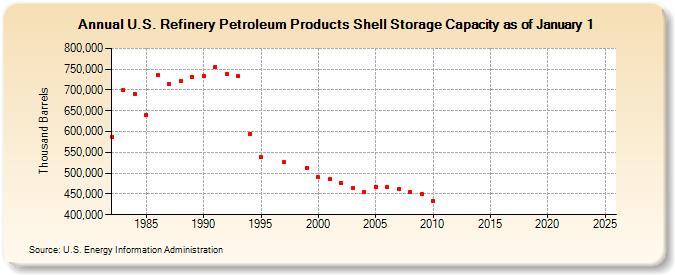
| U.S. Refinery Petroleum Products Shell Storage Capacity as of January 1 (Thousand Barrels) | |||||
| Decade | Year-0 | Year-1 | Year-2 | Year-3 | Year-4 | Year-5 | Year-6 | Year-7 | Year-8 | Year-9 |
|---|---|---|---|---|---|---|---|---|---|---|
| 1980's | 588,061 | 699,551 | 691,084 | 640,253 | 734,995 | 715,544 | 721,057 | 731,925 | ||
| 1990's | 732,828 | 755,736 | 738,918 | 733,556 | 593,860 | 538,454 | NA | 525,891 | NA | 512,532 |
| 2000's | 490,580 | 485,558 | 475,868 | 464,837 | 454,578 | 466,928 | 466,605 | 461,202 | 454,451 | 449,677 |
| 2010's | 433,429 | -- | -- | -- | -- | -- | -- | -- | -- | -- |
| 2020's | -- | -- | -- | -- |
| - = No Data Reported; -- = Not Applicable; NA = Not Available; W = Withheld to avoid disclosure of individual company data. |
| Release Date: 6/21/2022 |
| Next Release Date: June 2024 |