|
Download Data (XLS File) |
|
|||||
|
|||||
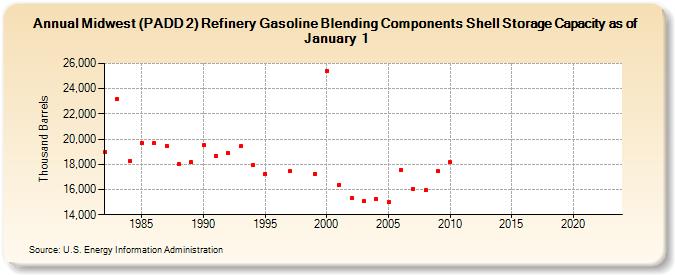
| Midwest (PADD 2) Refinery Gasoline Blending Components Shell Storage Capacity as of January 1 (Thousand Barrels) | |||||
| Decade | Year-0 | Year-1 | Year-2 | Year-3 | Year-4 | Year-5 | Year-6 | Year-7 | Year-8 | Year-9 |
|---|---|---|---|---|---|---|---|---|---|---|
| 1980's | 18,985 | 23,197 | 18,249 | 19,654 | 19,697 | 19,464 | 18,002 | 18,160 | ||
| 1990's | 19,497 | 18,672 | 18,920 | 19,427 | 17,951 | 17,226 | NA | 17,448 | NA | 17,252 |
| 2000's | 25,430 | 16,394 | 15,318 | 15,057 | 15,220 | 15,028 | 17,559 | 16,080 | 15,943 | 17,434 |
| 2010's | 18,145 | -- | -- | -- | -- | -- | -- | -- | -- | -- |
| 2020's | -- | -- | -- | -- |
| - = No Data Reported; -- = Not Applicable; NA = Not Available; W = Withheld to avoid disclosure of individual company data. |
| Release Date: 6/21/2022 |
| Next Release Date: June 2024 |