|
Download Data (XLS File) |
|
|||||
|
|||||
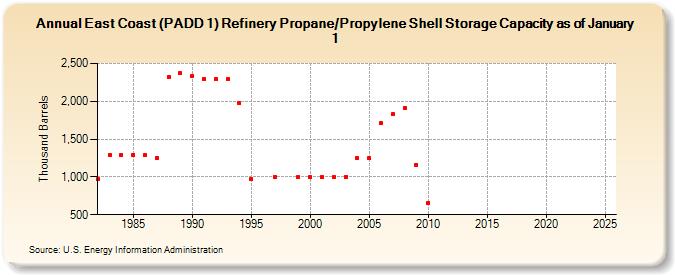
| East Coast (PADD 1) Refinery Propane/Propylene Shell Storage Capacity as of January 1 (Thousand Barrels) | |||||
| Decade | Year-0 | Year-1 | Year-2 | Year-3 | Year-4 | Year-5 | Year-6 | Year-7 | Year-8 | Year-9 |
|---|---|---|---|---|---|---|---|---|---|---|
| 1980's | 967 | 1,295 | 1,295 | 1,296 | 1,285 | 1,253 | 2,321 | 2,370 | ||
| 1990's | 2,330 | 2,296 | 2,291 | 2,291 | 1,978 | 975 | NA | 1,001 | NA | 997 |
| 2000's | 997 | 998 | 1,002 | 1,003 | 1,244 | 1,244 | 1,712 | 1,827 | 1,910 | 1,164 |
| 2010's | 656 | -- | -- | -- | -- | -- | -- | -- | -- | -- |
| 2020's | -- | -- | -- | -- | -- |
| - = No Data Reported; -- = Not Applicable; NA = Not Available; W = Withheld to avoid disclosure of individual company data. |
| Release Date: 6/14/2024 |
| Next Release Date: June 2025 |
Referring Pages: