|
Download Data (XLS File) |
|
|||||
|
|||||
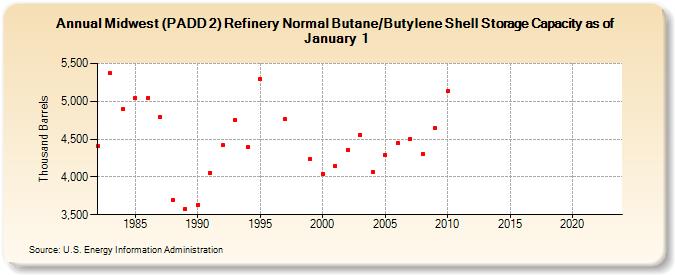
| Midwest (PADD 2) Refinery Normal Butane/Butylene Shell Storage Capacity as of January 1 (Thousand Barrels) | |||||
| Decade | Year-0 | Year-1 | Year-2 | Year-3 | Year-4 | Year-5 | Year-6 | Year-7 | Year-8 | Year-9 |
|---|---|---|---|---|---|---|---|---|---|---|
| 1980's | 4,405 | 5,373 | 4,898 | 5,044 | 5,049 | 4,797 | 3,696 | 3,582 | ||
| 1990's | 3,633 | 4,056 | 4,421 | 4,753 | 4,391 | 5,294 | NA | 4,762 | NA | 4,236 |
| 2000's | 4,044 | 4,145 | 4,361 | 4,555 | 4,069 | 4,286 | 4,452 | 4,498 | 4,305 | 4,647 |
| 2010's | 5,135 | -- | -- | -- | -- | -- | -- | -- | -- | -- |
| 2020's | -- | -- | -- | -- |
| - = No Data Reported; -- = Not Applicable; NA = Not Available; W = Withheld to avoid disclosure of individual company data. |
| Release Date: 6/21/2022 |
| Next Release Date: June 2024 |