|
Download Data (XLS File) |
|
|||||
|
|||||
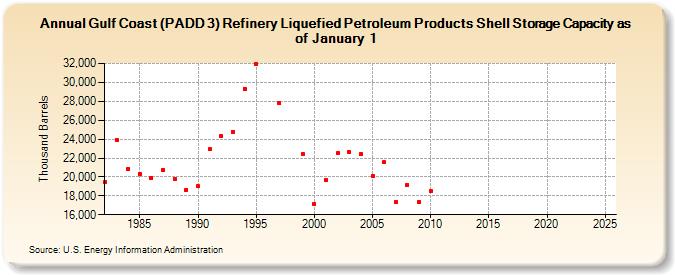
| Gulf Coast (PADD 3) Refinery Liquefied Petroleum Products Shell Storage Capacity as of January 1 (Thousand Barrels) | |||||
| Decade | Year-0 | Year-1 | Year-2 | Year-3 | Year-4 | Year-5 | Year-6 | Year-7 | Year-8 | Year-9 |
|---|---|---|---|---|---|---|---|---|---|---|
| 1980's | 19,473 | 23,929 | 20,886 | 20,326 | 19,893 | 20,758 | 19,829 | 18,645 | ||
| 1990's | 18,988 | 22,906 | 24,304 | 24,784 | 29,341 | 31,940 | NA | 27,779 | NA | 22,430 |
| 2000's | 17,126 | 19,710 | 22,481 | 22,654 | 22,411 | 20,104 | 21,544 | 17,383 | 19,159 | 17,323 |
| 2010's | 18,528 | -- | -- | -- | -- | -- | -- | -- | -- | -- |
| 2020's | -- | -- | -- | -- |
| - = No Data Reported; -- = Not Applicable; NA = Not Available; W = Withheld to avoid disclosure of individual company data. |
| Release Date: 6/21/2022 |
| Next Release Date: June 2024 |