|
Download Data (XLS File) |
|
|||||
|
|||||
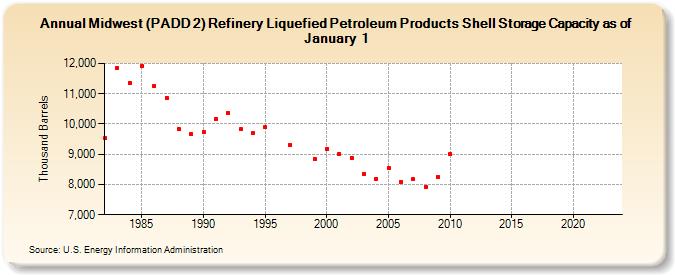
| Midwest (PADD 2) Refinery Liquefied Petroleum Products Shell Storage Capacity as of January 1 (Thousand Barrels) | |||||
| Decade | Year-0 | Year-1 | Year-2 | Year-3 | Year-4 | Year-5 | Year-6 | Year-7 | Year-8 | Year-9 |
|---|---|---|---|---|---|---|---|---|---|---|
| 1980's | 9,532 | 11,853 | 11,357 | 11,920 | 11,261 | 10,868 | 9,822 | 9,667 | ||
| 1990's | 9,723 | 10,160 | 10,375 | 9,819 | 9,690 | 9,890 | NA | 9,318 | NA | 8,838 |
| 2000's | 9,184 | 9,009 | 8,888 | 8,359 | 8,184 | 8,558 | 8,094 | 8,165 | 7,928 | 8,262 |
| 2010's | 9,004 | -- | -- | -- | -- | -- | -- | -- | -- | -- |
| 2020's | -- | -- | -- | -- |
| - = No Data Reported; -- = Not Applicable; NA = Not Available; W = Withheld to avoid disclosure of individual company data. |
| Release Date: 6/21/2022 |
| Next Release Date: June 2024 |