|
Download Data (XLS File) |
|
|||||
|
|||||
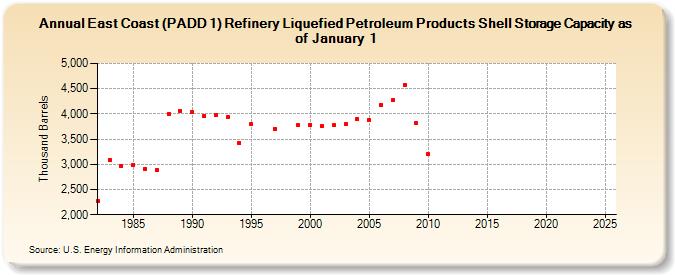
| East Coast (PADD 1) Refinery Liquefied Petroleum Products Shell Storage Capacity as of January 1 (Thousand Barrels) | |||||
| Decade | Year-0 | Year-1 | Year-2 | Year-3 | Year-4 | Year-5 | Year-6 | Year-7 | Year-8 | Year-9 |
|---|---|---|---|---|---|---|---|---|---|---|
| 1980's | 2,275 | 3,093 | 2,974 | 2,992 | 2,912 | 2,890 | 3,998 | 4,067 | ||
| 1990's | 4,041 | 3,962 | 3,971 | 3,948 | 3,420 | 3,794 | NA | 3,706 | NA | 3,773 |
| 2000's | 3,788 | 3,766 | 3,773 | 3,794 | 3,897 | 3,873 | 4,183 | 4,267 | 4,576 | 3,814 |
| 2010's | 3,209 | -- | -- | -- | -- | -- | -- | -- | -- | -- |
| 2020's | -- | -- | -- | -- |
| - = No Data Reported; -- = Not Applicable; NA = Not Available; W = Withheld to avoid disclosure of individual company data. |
| Release Date: 6/21/2022 |
| Next Release Date: June 2024 |