|
Download Data (XLS File) |
|
|||||
|
|||||
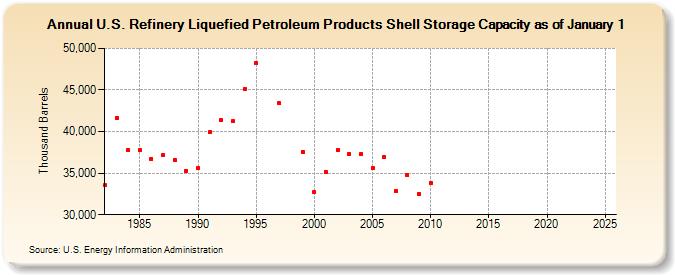
| U.S. Refinery Liquefied Petroleum Products Shell Storage Capacity as of January 1 (Thousand Barrels) | |||||
| Decade | Year-0 | Year-1 | Year-2 | Year-3 | Year-4 | Year-5 | Year-6 | Year-7 | Year-8 | Year-9 |
|---|---|---|---|---|---|---|---|---|---|---|
| 1980's | 33,519 | 41,633 | 37,764 | 37,738 | 36,724 | 37,186 | 36,624 | 35,264 | ||
| 1990's | 35,621 | 39,917 | 41,330 | 41,228 | 45,121 | 48,212 | NA | 43,396 | NA | 37,586 |
| 2000's | 32,726 | 35,124 | 37,784 | 37,317 | 37,299 | 35,613 | 36,973 | 32,853 | 34,772 | 32,498 |
| 2010's | 33,842 | -- | -- | -- | -- | -- | -- | -- | -- | -- |
| 2020's | -- | -- | -- | -- |
| - = No Data Reported; -- = Not Applicable; NA = Not Available; W = Withheld to avoid disclosure of individual company data. |
| Release Date: 6/21/2022 |
| Next Release Date: June 2024 |