|
Download Data (XLS File) |
|
|||||
|
|||||
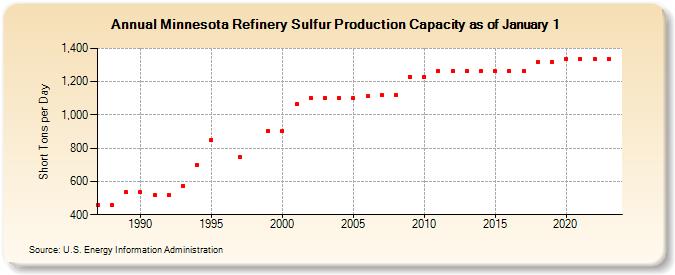
| Minnesota Refinery Sulfur Production Capacity as of January 1 (Short Tons per Day) | |||||
| Decade | Year-0 | Year-1 | Year-2 | Year-3 | Year-4 | Year-5 | Year-6 | Year-7 | Year-8 | Year-9 |
|---|---|---|---|---|---|---|---|---|---|---|
| 1980's | 459 | 459 | 534 | |||||||
| 1990's | 534 | 519 | 519 | 575 | 700 | 850 | NA | 750 | NA | 905 |
| 2000's | 903 | 1,063 | 1,103 | 1,103 | 1,103 | 1,102 | 1,111 | 1,121 | 1,119 | 1,230 |
| 2010's | 1,230 | 1,264 | 1,264 | 1,264 | 1,264 | 1,264 | 1,264 | 1,264 | 1,320 | 1,320 |
| 2020's | 1,339 | 1,339 | 1,339 | 1,339 |
| - = No Data Reported; -- = Not Applicable; NA = Not Available; W = Withheld to avoid disclosure of individual company data. |
| Release Date: 6/21/2022 |
| Next Release Date: June 2024 |
Referring Pages: