|
Download Data (XLS File) |
|
|||||
|
|||||
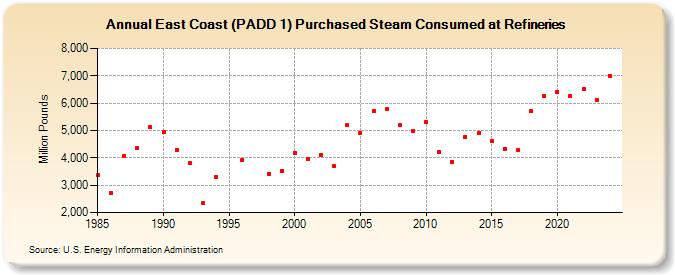
| East Coast (PADD 1) Purchased Steam Consumed at Refineries (Million Pounds) | |||||
| Decade | Year-0 | Year-1 | Year-2 | Year-3 | Year-4 | Year-5 | Year-6 | Year-7 | Year-8 | Year-9 |
|---|---|---|---|---|---|---|---|---|---|---|
| 1980's | 3,372 | 2,713 | 4,074 | 4,342 | 5,116 | |||||
| 1990's | 4,936 | 4,295 | 3,818 | 2,339 | 3,315 | NA | 3,936 | NA | 3,415 | 3,525 |
| 2000's | 4,182 | 3,962 | 4,112 | 3,691 | 5,186 | 4,912 | 5,716 | 5,784 | 5,204 | 4,998 |
| 2010's | 5,305 | 4,212 | 3,849 | 4,778 | 4,901 | 4,611 | 4,323 | 4,272 | 5,714 | 6,246 |
| 2020's | 6,423 | 6,248 | 6,512 |
| - = No Data Reported; -- = Not Applicable; NA = Not Available; W = Withheld to avoid disclosure of individual company data. |
| Release Date: 6/21/2022 |
| Next Release Date: June 2024 |
Referring Pages: