|
Download Data (XLS File) |
|
|||||
|
|||||
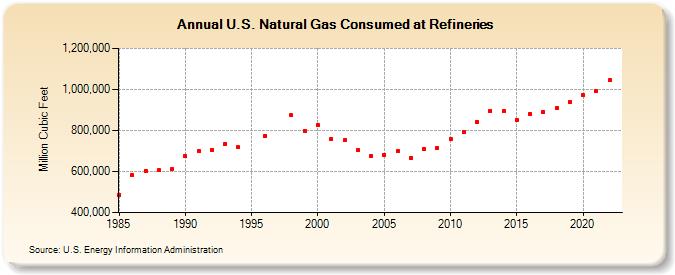
| U.S. Natural Gas Consumed at Refineries (Million Cubic Feet) | |||||
| Decade | Year-0 | Year-1 | Year-2 | Year-3 | Year-4 | Year-5 | Year-6 | Year-7 | Year-8 | Year-9 |
|---|---|---|---|---|---|---|---|---|---|---|
| 1980's | 487,830 | 581,743 | 604,873 | 605,729 | 612,948 | |||||
| 1990's | 673,283 | 698,875 | 706,348 | 735,939 | 717,937 | NA | 774,324 | NA | 873,750 | 799,523 |
| 2000's | 826,017 | 760,339 | 752,039 | 703,684 | 674,985 | 682,919 | 697,593 | 667,986 | 710,500 | 713,532 |
| 2010's | 756,062 | 791,753 | 843,228 | 897,049 | 893,203 | 852,067 | 881,611 | 888,922 | 908,775 | 939,929 |
| 2020's | 972,271 | 990,526 | 1,043,629 |
| - = No Data Reported; -- = Not Applicable; NA = Not Available; W = Withheld to avoid disclosure of individual company data. |
| Release Date: 6/21/2022 |
| Next Release Date: June 2024 |
Referring Pages: