|
Download Data (XLS File) |
|
||||||||
|
||||||||
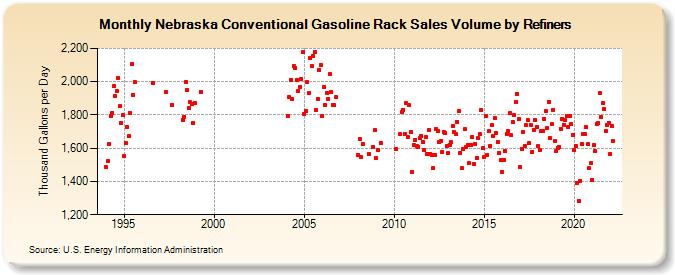
| Nebraska Conventional Gasoline Rack Sales Volume by Refiners (Thousand Gallons per Day) | ||||||||
| Year | Jan | Feb | Mar | Apr | May | Jun | Jul | Aug | Sep | Oct | Nov | Dec |
|---|---|---|---|---|---|---|---|---|---|---|---|---|
| 1994 | 1,485.3 | 1,524.1 | 1,626.9 | 1,792.0 | 1,812.4 | 1,973.9 | 1,914.9 | 1,941.9 | 2,024.7 | 1,851.7 | 1,754.0 | 1,798.9 |
| 1995 | 1,550.8 | 1,630.2 | 1,728.3 | 1,672.4 | 1,814.1 | 2,105.3 | 1,918.8 | 1,996.5 | W | W | W | W |
| 1996 | W | W | W | W | W | W | W | 1,994.9 | W | W | W | W |
| 1997 | W | W | W | W | 1,939.7 | W | W | W | 1,862.2 | W | W | W |
| 1998 | W | W | W | 1,768.5 | 1,787.9 | 1,999.1 | 1,952.1 | 1,838.8 | 1,875.8 | 1,868.4 | 1,751.6 | 1,873.9 |
| 1999 | W | W | W | 1,938.9 | W | W | W | W | W | W | W | W |
| 2000 | W | W | W | W | W | W | W | W | W | W | W | W |
| 2001 | W | W | W | W | W | W | W | W | W | W | W | W |
| 2002 | W | W | W | W | W | W | W | W | W | W | W | W |
| 2003 | W | W | W | W | W | W | W | W | W | W | W | W |
| 2004 | W | 1,795.6 | 1,910.5 | 2,007.5 | 1,895.1 | 2,093.2 | 2,080.9 | 2,009.8 | 1,946.4 | 1,969.8 | 2,016.4 | 2,175.9 |
| 2005 | 1,804.9 | 1,825.2 | 1,996.3 | 1,930.5 | 2,139.3 | 2,093.2 | 2,154.4 | 2,180.7 | 1,830.7 | 1,896.8 | 2,070.5 | 2,100.2 |
| 2006 | 1,793.4 | 1,967.9 | 1,862.0 | 1,933.5 | 1,897.8 | 2,045.4 | 1,936.8 | 1,858.7 | 1,856.7 | 1,906.1 | W | W |
| 2007 | W | W | W | W | W | W | W | W | W | W | W | W |
| 2008 | 1,560.8 | 1,654.8 | 1,545.6 | 1,625.6 | W | W | W | 1,564.6 | W | W | 1,609.3 | 1,707.4 |
| 2009 | 1,539.0 | 1,587.8 | W | 1,629.2 | W | W | W | W | W | W | W | W |
| 2010 | W | 1,593.3 | W | W | 1,682.3 | 1,816.5 | 1,831.6 | 1,684.6 | 1,869.3 | 1,666.6 | 1,857.0 | 1,696.1 |
| 2011 | 1,457.2 | 1,622.0 | 1,648.1 | 1,612.4 | 1,610.1 | 1,660.5 | 1,674.7 | 1,637.0 | 1,589.5 | 1,666.9 | 1,566.7 | 1,707.9 |
| 2012 | 1,564.3 | 1,558.0 | 1,478.8 | 1,557.5 | 1,716.7 | 1,703.1 | 1,635.3 | 1,641.9 | 1,577.4 | 1,697.4 | 1,692.8 | 1,614.4 |
| 2013 | 1,568.3 | 1,621.4 | 1,634.5 | 1,730.9 | 1,696.4 | 1,682.3 | 1,759.1 | 1,821.9 | 1,573.0 | 1,481.8 | 1,593.0 | 1,713.5 |
| 2014 | 1,606.7 | 1,621.8 | 1,512.4 | 1,620.9 | 1,666.5 | 1,507.0 | 1,627.8 | 1,540.8 | 1,660.3 | 1,685.2 | 1,828.6 | 1,599.3 |
| 2015 | 1,547.5 | 1,794.5 | 1,557.6 | 1,701.0 | 1,613.9 | 1,740.6 | 1,672.9 | 1,782.2 | 1,691.2 | 1,637.0 | 1,570.9 | 1,528.4 |
| 2016 | 1,457.6 | 1,530.2 | 1,580.7 | 1,686.3 | 1,702.7 | 1,809.8 | 1,677.2 | 1,757.6 | 1,797.2 | 1,878.5 | 1,927.6 | 1,774.8 |
| 2017 | 1,484.3 | 1,597.4 | 1,695.0 | 1,612.0 | 1,739.3 | 1,767.9 | 1,630.7 | 1,741.5 | 1,579.4 | 1,708.0 | 1,766.7 | 1,727.5 |
| 2018 | 1,612.2 | 1,586.6 | 1,700.7 | 1,705.2 | 1,777.3 | 1,823.2 | 1,720.1 | 1,878.4 | 1,661.1 | 1,744.2 | 1,830.3 | 1,643.8 |
| 2019 | 1,580.5 | 1,602.0 | 1,604.5 | 1,716.9 | 1,776.7 | 1,741.6 | 1,768.9 | 1,795.2 | 1,726.9 | 1,795.4 | 1,744.3 | 1,681.5 |
| 2020 | 1,587.5 | 1,610.2 | 1,392.7 | 1,281.9 | 1,402.2 | 1,626.1 | 1,687.2 | 1,683.4 | 1,724.7 | 1,622.9 | 1,479.0 | 1,512.3 |
| 2021 | 1,411.1 | 1,617.1 | 1,580.5 | 1,745.4 | 1,749.5 | 1,933.9 | 1,788.8 | 1,869.2 | 1,838.0 | 1,702.8 | 1,739.3 | 1,752.3 |
| 2022 | 1,566.1 | 1,732.0 | 1,641.2 | |||||||||
| - = No Data Reported; -- = Not Applicable; NA = Not Available; W = Withheld to avoid disclosure of individual company data. |
| Release Date: 6/1/2022 |
| Next Release Date: TBD |