|
Download Data (XLS File) |
|
||||||||
|
||||||||
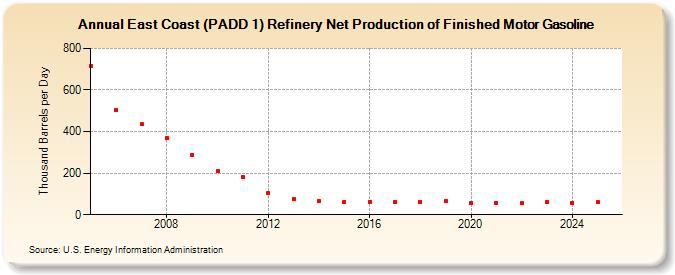
| East Coast (PADD 1) Refinery Net Production of Finished Motor Gasoline (Thousand Barrels per Day) | ||||||||
| Decade | Year-0 | Year-1 | Year-2 | Year-3 | Year-4 | Year-5 | Year-6 | Year-7 | Year-8 | Year-9 |
|---|---|---|---|---|---|---|---|---|---|---|
| 2000's | 714 | 502 | 435 | 368 | 287 | |||||
| 2010's | 211 | 181 | 103 | 76 | 67 | 63 | 63 | 61 | 60 | 66 |
| 2020's | 56 | 56 | 56 | 60 |
| - = No Data Reported; -- = Not Applicable; NA = Not Available; W = Withheld to avoid disclosure of individual company data. |
| Release Date: 5/31/2024 |
| Next Release Date: 8/30/2024 |