|
Download Data (XLS File) |
|
||||||||
|
||||||||
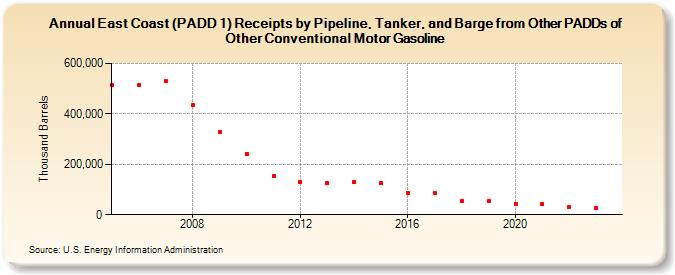
| East Coast (PADD 1) Receipts by Pipeline, Tanker, and Barge from Other PADDs of Other Conventional Motor Gasoline (Thousand Barrels) | ||||||||
| Decade | Year-0 | Year-1 | Year-2 | Year-3 | Year-4 | Year-5 | Year-6 | Year-7 | Year-8 | Year-9 |
|---|---|---|---|---|---|---|---|---|---|---|
| 2000's | 514,888 | 515,462 | 529,503 | 434,457 | 328,843 | |||||
| 2010's | 240,406 | 152,666 | 129,095 | 124,889 | 131,337 | 125,452 | 86,758 | 84,431 | 52,733 | 53,206 |
| 2020's | 44,483 | 41,898 | 28,746 | 26,909 |
| - = No Data Reported; -- = Not Applicable; NA = Not Available; W = Withheld to avoid disclosure of individual company data. |
| Release Date: 5/31/2024 |
| Next Release Date: 8/30/2024 |
Referring Pages: