|
Download Data (XLS File) |
|
|||||
|
|||||
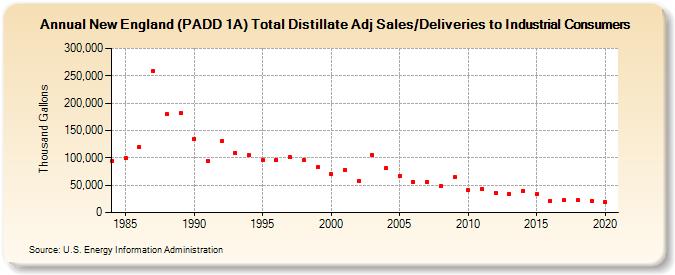
| New England (PADD 1A) Total Distillate Adj Sales/Deliveries to Industrial Consumers (Thousand Gallons) | |||||
| Decade | Year-0 | Year-1 | Year-2 | Year-3 | Year-4 | Year-5 | Year-6 | Year-7 | Year-8 | Year-9 |
|---|---|---|---|---|---|---|---|---|---|---|
| 1980's | 94,667 | 99,006 | 119,915 | 258,906 | 179,249 | 181,767 | ||||
| 1990's | 135,204 | 94,964 | 130,360 | 109,548 | 104,895 | 95,439 | 95,792 | 101,021 | 96,280 | 82,686 |
| 2000's | 69,984 | 78,240 | 56,941 | 105,206 | 81,026 | 67,305 | 55,466 | 55,730 | 47,633 | 64,412 |
| 2010's | 40,455 | 43,732 | 36,303 | 34,617 | 39,620 | 33,534 | 21,485 | 22,861 | 22,779 | 21,311 |
| 2020's | 19,770 |
| - = No Data Reported; -- = Not Applicable; NA = Not Available; W = Withheld to avoid disclosure of individual company data. |
| Release Date: 2/9/2022 |
| Next Release Date: Suspended |