|
Download Data (XLS File) |
|
|||||
|
|||||
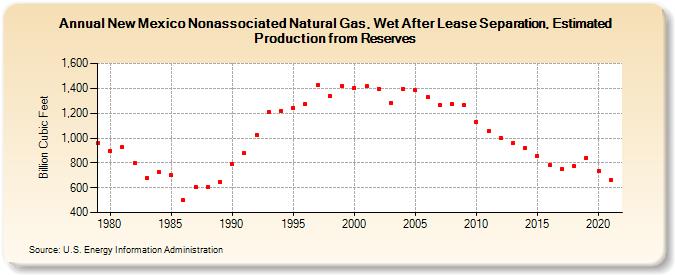
| New Mexico Nonassociated Natural Gas, Wet After Lease Separation, Estimated Production from Reserves (Billion Cubic Feet) | |||||
| Decade | Year-0 | Year-1 | Year-2 | Year-3 | Year-4 | Year-5 | Year-6 | Year-7 | Year-8 | Year-9 |
|---|---|---|---|---|---|---|---|---|---|---|
| 1970's | 961 | |||||||||
| 1980's | 896 | 925 | 802 | 677 | 724 | 700 | 499 | 607 | 608 | 649 |
| 1990's | 794 | 879 | 1,027 | 1,212 | 1,220 | 1,242 | 1,272 | 1,423 | 1,339 | 1,421 |
| 2000's | 1,400 | 1,415 | 1,397 | 1,284 | 1,397 | 1,383 | 1,332 | 1,264 | 1,274 | 1,264 |
| 2010's | 1,131 | 1,056 | 1,004 | 958 | 920 | 859 | 784 | 751 | 773 | 843 |
| 2020's | 734 | 664 |
| - = No Data Reported; -- = Not Applicable; NA = Not Available; W = Withheld to avoid disclosure of individual company data. |
| Release Date: 12/30/2022 |
| Next Release Date: 12/29/2023 |