|
Download Data (XLS File) |
|
|||||
|
|||||
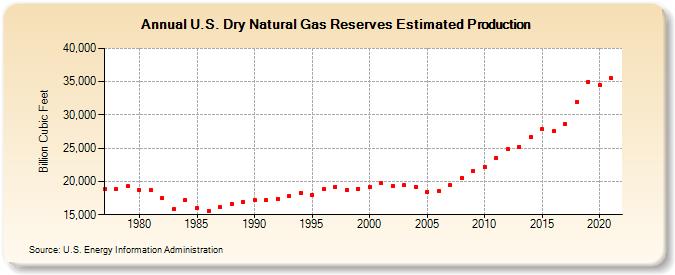
| U.S. Dry Natural Gas Reserves Estimated Production (Billion Cubic Feet) | |||||
| Decade | Year-0 | Year-1 | Year-2 | Year-3 | Year-4 | Year-5 | Year-6 | Year-7 | Year-8 | Year-9 |
|---|---|---|---|---|---|---|---|---|---|---|
| 1970's | 18,843 | 18,805 | 19,257 | |||||||
| 1980's | 18,699 | 18,737 | 17,506 | 15,788 | 17,193 | 15,985 | 15,610 | 16,114 | 16,670 | 16,983 |
| 1990's | 17,233 | 17,202 | 17,423 | 17,789 | 18,322 | 17,966 | 18,861 | 19,211 | 18,720 | 18,928 |
| 2000's | 19,219 | 19,779 | 19,353 | 19,425 | 19,168 | 18,458 | 18,545 | 19,466 | 20,523 | 21,594 |
| 2010's | 22,239 | 23,555 | 24,912 | 25,233 | 26,611 | 27,818 | 27,558 | 28,634 | 31,988 | 34,996 |
| 2020's | 34,523 | 35,478 |
| - = No Data Reported; -- = Not Applicable; NA = Not Available; W = Withheld to avoid disclosure of individual company data. |
| Release Date: 12/30/2022 |
| Next Release Date: 12/29/2023 |