|
Download Data (XLS File) |
|
|||||
|
|||||
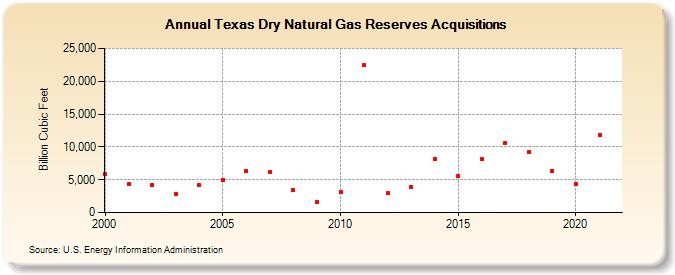
| Texas Dry Natural Gas Reserves Acquisitions (Billion Cubic Feet) | |||||
| Decade | Year-0 | Year-1 | Year-2 | Year-3 | Year-4 | Year-5 | Year-6 | Year-7 | Year-8 | Year-9 |
|---|---|---|---|---|---|---|---|---|---|---|
| 2000's | 5,873 | 4,297 | 4,249 | 2,878 | 4,137 | 5,024 | 6,366 | 6,244 | 3,442 | 1,563 |
| 2010's | 3,179 | 22,546 | 3,000 | 3,942 | 8,111 | 5,618 | 8,110 | 10,530 | 9,237 | 6,396 |
| 2020's | 4,393 | 11,860 |
| - = No Data Reported; -- = Not Applicable; NA = Not Available; W = Withheld to avoid disclosure of individual company data. |
| Release Date: 12/30/2022 |
| Next Release Date: 12/29/2023 |