|
Download Data (XLS File) |
|
|||||
|
|||||
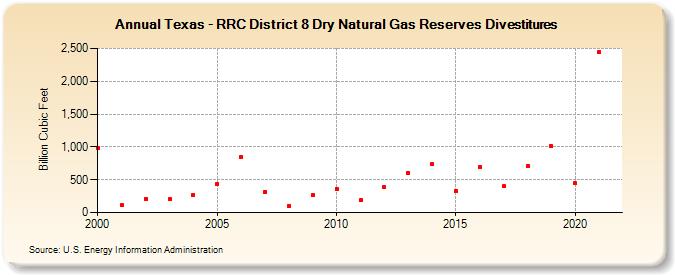
| Texas - RRC District 8 Dry Natural Gas Reserves Divestitures (Billion Cubic Feet) | |||||
| Decade | Year-0 | Year-1 | Year-2 | Year-3 | Year-4 | Year-5 | Year-6 | Year-7 | Year-8 | Year-9 |
|---|---|---|---|---|---|---|---|---|---|---|
| 2000's | 989 | 111 | 209 | 202 | 269 | 430 | 845 | 320 | 101 | 260 |
| 2010's | 363 | 185 | 385 | 608 | 734 | 328 | 689 | 400 | 706 | 1,011 |
| 2020's | 444 | 2,444 |
| - = No Data Reported; -- = Not Applicable; NA = Not Available; W = Withheld to avoid disclosure of individual company data. |
| Release Date: 12/30/2022 |
| Next Release Date: 12/29/2023 |