|
Download Data (XLS File) |
|
|||||
|
|||||
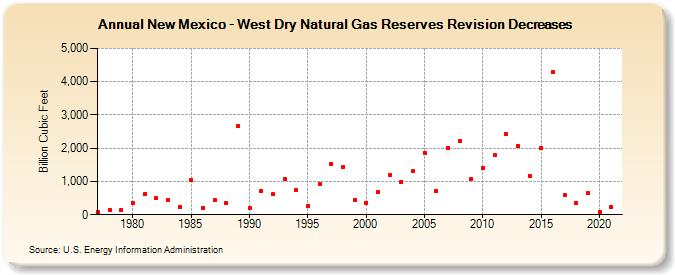
| New Mexico - West Dry Natural Gas Reserves Revision Decreases (Billion Cubic Feet) | |||||
| Decade | Year-0 | Year-1 | Year-2 | Year-3 | Year-4 | Year-5 | Year-6 | Year-7 | Year-8 | Year-9 |
|---|---|---|---|---|---|---|---|---|---|---|
| 1970's | 84 | 130 | 135 | |||||||
| 1980's | 343 | 620 | 492 | 438 | 217 | 1,057 | 207 | 428 | 354 | 2,664 |
| 1990's | 208 | 707 | 611 | 1,068 | 738 | 272 | 924 | 1,534 | 1,443 | 453 |
| 2000's | 362 | 696 | 1,192 | 991 | 1,304 | 1,857 | 708 | 2,018 | 2,216 | 1,080 |
| 2010's | 1,415 | 1,798 | 2,426 | 2,076 | 1,174 | 2,007 | 4,299 | 597 | 343 | 657 |
| 2020's | 91 | 225 |
| - = No Data Reported; -- = Not Applicable; NA = Not Available; W = Withheld to avoid disclosure of individual company data. |
| Release Date: 12/30/2022 |
| Next Release Date: 12/29/2023 |