|
Download Data (XLS File) |
|
|||||
|
|||||
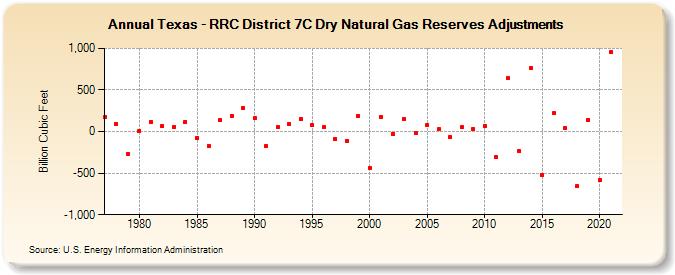
| Texas - RRC District 7C Dry Natural Gas Reserves Adjustments (Billion Cubic Feet) | |||||
| Decade | Year-0 | Year-1 | Year-2 | Year-3 | Year-4 | Year-5 | Year-6 | Year-7 | Year-8 | Year-9 |
|---|---|---|---|---|---|---|---|---|---|---|
| 1970's | 172 | 91 | -264 | |||||||
| 1980's | 12 | 115 | 64 | 59 | 119 | -73 | -173 | 137 | 191 | 287 |
| 1990's | 163 | -176 | 56 | 89 | 151 | 80 | 51 | -87 | -108 | 192 |
| 2000's | -437 | 175 | -25 | 149 | -21 | 79 | 25 | -65 | 49 | 29 |
| 2010's | 68 | -311 | 639 | -236 | 764 | -520 | 220 | 45 | -660 | 144 |
| 2020's | -584 | 959 |
| - = No Data Reported; -- = Not Applicable; NA = Not Available; W = Withheld to avoid disclosure of individual company data. |
| Release Date: 12/30/2022 |
| Next Release Date: 12/29/2023 |