|
Download Data (XLS File) |
|
|||||
|
|||||
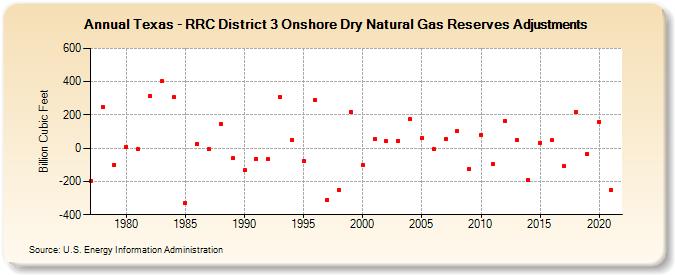
| Texas - RRC District 3 Onshore Dry Natural Gas Reserves Adjustments (Billion Cubic Feet) | |||||
| Decade | Year-0 | Year-1 | Year-2 | Year-3 | Year-4 | Year-5 | Year-6 | Year-7 | Year-8 | Year-9 |
|---|---|---|---|---|---|---|---|---|---|---|
| 1970's | -198 | 248 | -99 | |||||||
| 1980's | 10 | -6 | 315 | 402 | 305 | -329 | 27 | -5 | 148 | -61 |
| 1990's | -132 | -63 | -67 | 310 | 52 | -79 | 290 | -310 | -250 | 220 |
| 2000's | -102 | 54 | 43 | 45 | 175 | 62 | -5 | 56 | 104 | -124 |
| 2010's | 82 | -95 | 164 | 49 | -191 | 34 | 47 | -109 | 217 | -33 |
| 2020's | 159 | -250 |
| - = No Data Reported; -- = Not Applicable; NA = Not Available; W = Withheld to avoid disclosure of individual company data. |
| Release Date: 12/30/2022 |
| Next Release Date: 12/29/2023 |