|
Download Data (XLS File) |
|
|||||
|
|||||
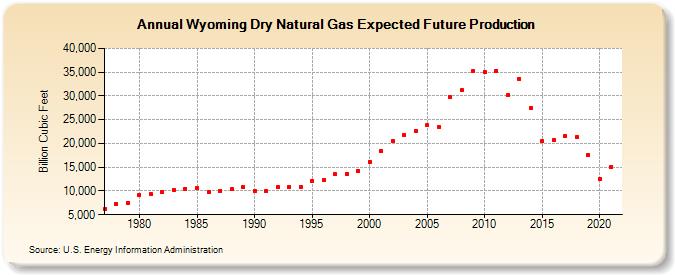
| Wyoming Dry Natural Gas Expected Future Production (Billion Cubic Feet) | |||||
| Decade | Year-0 | Year-1 | Year-2 | Year-3 | Year-4 | Year-5 | Year-6 | Year-7 | Year-8 | Year-9 |
|---|---|---|---|---|---|---|---|---|---|---|
| 1970's | 6,305 | 7,211 | 7,526 | |||||||
| 1980's | 9,100 | 9,307 | 9,758 | 10,227 | 10,482 | 10,617 | 9,756 | 10,023 | 10,308 | 10,744 |
| 1990's | 9,944 | 9,941 | 10,826 | 10,933 | 10,879 | 12,166 | 12,320 | 13,562 | 13,650 | 14,226 |
| 2000's | 16,158 | 18,398 | 20,527 | 21,744 | 22,632 | 23,774 | 23,549 | 29,710 | 31,143 | 35,283 |
| 2010's | 35,074 | 35,290 | 30,094 | 33,618 | 27,553 | 20,436 | 20,818 | 21,549 | 21,343 | 17,569 |
| 2020's | 12,484 | 15,005 |
| - = No Data Reported; -- = Not Applicable; NA = Not Available; W = Withheld to avoid disclosure of individual company data. |
| Release Date: 12/30/2022 |
| Next Release Date: 12/29/2023 |