|
Download Data (XLS File) |
|
|||||
|
|||||
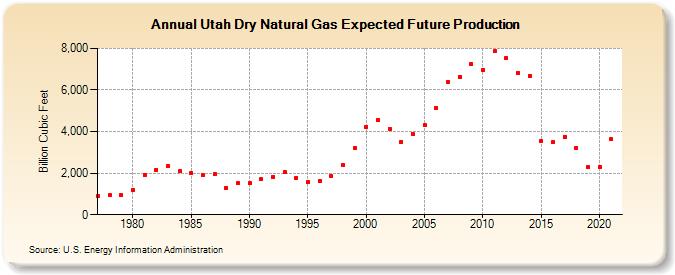
| Utah Dry Natural Gas Expected Future Production (Billion Cubic Feet) | |||||
| Decade | Year-0 | Year-1 | Year-2 | Year-3 | Year-4 | Year-5 | Year-6 | Year-7 | Year-8 | Year-9 |
|---|---|---|---|---|---|---|---|---|---|---|
| 1970's | 877 | 925 | 948 | |||||||
| 1980's | 1,201 | 1,912 | 2,161 | 2,333 | 2,080 | 1,999 | 1,895 | 1,947 | 1,298 | 1,507 |
| 1990's | 1,510 | 1,702 | 1,830 | 2,040 | 1,789 | 1,580 | 1,633 | 1,839 | 2,388 | 3,213 |
| 2000's | 4,235 | 4,579 | 4,135 | 3,516 | 3,866 | 4,295 | 5,146 | 6,391 | 6,643 | 7,257 |
| 2010's | 6,981 | 7,857 | 7,548 | 6,829 | 6,685 | 3,547 | 3,494 | 3,752 | 3,213 | 2,279 |
| 2020's | 2,296 | 3,638 |
| - = No Data Reported; -- = Not Applicable; NA = Not Available; W = Withheld to avoid disclosure of individual company data. |
| Release Date: 12/30/2022 |
| Next Release Date: 12/29/2023 |