|
Download Data (XLS File) |
|
|||||
|
|||||
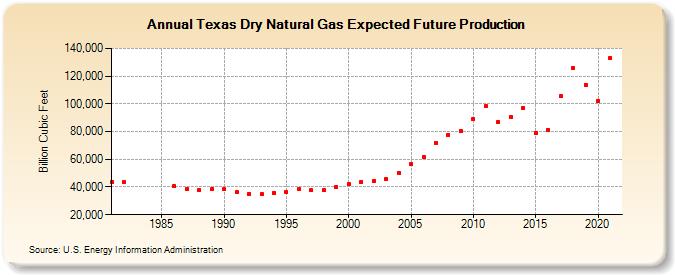
| Texas Dry Natural Gas Expected Future Production (Billion Cubic Feet) | |||||
| Decade | Year-0 | Year-1 | Year-2 | Year-3 | Year-4 | Year-5 | Year-6 | Year-7 | Year-8 | Year-9 |
|---|---|---|---|---|---|---|---|---|---|---|
| 1980's | 43,591 | 43,264 | 40,574 | 38,711 | 38,167 | 38,381 | ||||
| 1990's | 38,192 | 36,174 | 35,093 | 34,718 | 35,974 | 36,542 | 38,270 | 37,761 | 37,584 | 40,157 |
| 2000's | 42,082 | 43,527 | 44,297 | 45,730 | 49,955 | 56,507 | 61,836 | 72,091 | 77,546 | 80,424 |
| 2010's | 88,997 | 98,165 | 86,924 | 90,349 | 97,154 | 78,866 | 81,224 | 105,618 | 126,131 | 113,736 |
| 2020's | 102,370 | 133,169 |
| - = No Data Reported; -- = Not Applicable; NA = Not Available; W = Withheld to avoid disclosure of individual company data. |
| Release Date: 12/30/2022 |
| Next Release Date: NA |