|
Download Data (XLS File) |
|
|||||
|
|||||
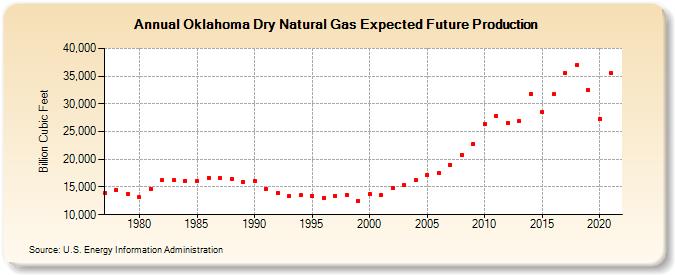
| Oklahoma Dry Natural Gas Expected Future Production (Billion Cubic Feet) | |||||
| Decade | Year-0 | Year-1 | Year-2 | Year-3 | Year-4 | Year-5 | Year-6 | Year-7 | Year-8 | Year-9 |
|---|---|---|---|---|---|---|---|---|---|---|
| 1970's | 13,889 | 14,417 | 13,816 | |||||||
| 1980's | 13,138 | 14,699 | 16,207 | 16,211 | 16,126 | 16,040 | 16,685 | 16,711 | 16,495 | 15,916 |
| 1990's | 16,151 | 14,725 | 13,926 | 13,289 | 13,487 | 13,438 | 13,074 | 13,439 | 13,645 | 12,543 |
| 2000's | 13,699 | 13,558 | 14,886 | 15,401 | 16,238 | 17,123 | 17,464 | 19,031 | 20,845 | 22,769 |
| 2010's | 26,345 | 27,830 | 26,599 | 26,873 | 31,778 | 28,486 | 31,712 | 35,491 | 37,035 | 32,527 |
| 2020's | 27,227 | 35,531 |
| - = No Data Reported; -- = Not Applicable; NA = Not Available; W = Withheld to avoid disclosure of individual company data. |
| Release Date: 12/30/2022 |
| Next Release Date: 12/29/2023 |