|
Download Data (XLS File) |
|
|||||
|
|||||
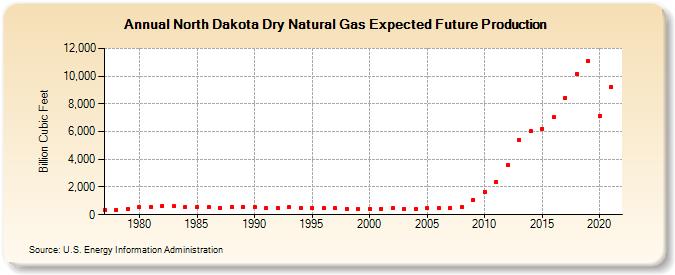
| North Dakota Dry Natural Gas Expected Future Production (Billion Cubic Feet) | |||||
| Decade | Year-0 | Year-1 | Year-2 | Year-3 | Year-4 | Year-5 | Year-6 | Year-7 | Year-8 | Year-9 |
|---|---|---|---|---|---|---|---|---|---|---|
| 1970's | 361 | 374 | 439 | |||||||
| 1980's | 537 | 581 | 629 | 600 | 566 | 569 | 541 | 508 | 541 | 561 |
| 1990's | 586 | 472 | 496 | 525 | 507 | 463 | 462 | 479 | 447 | 416 |
| 2000's | 433 | 443 | 471 | 448 | 417 | 453 | 479 | 511 | 541 | 1,079 |
| 2010's | 1,667 | 2,381 | 3,569 | 5,420 | 6,034 | 6,203 | 7,030 | 8,445 | 10,166 | 11,104 |
| 2020's | 7,133 | 9,224 |
| - = No Data Reported; -- = Not Applicable; NA = Not Available; W = Withheld to avoid disclosure of individual company data. |
| Release Date: 12/30/2022 |
| Next Release Date: 12/29/2023 |