|
Download Data (XLS File) |
|
|||||
|
|||||
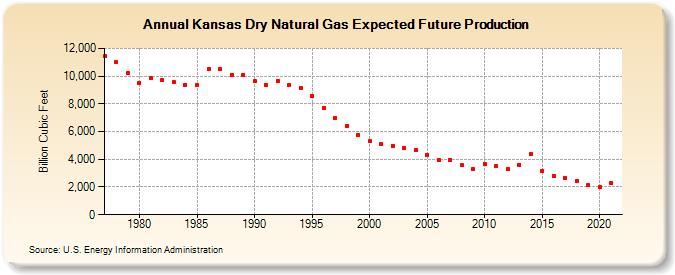
| Kansas Dry Natural Gas Expected Future Production (Billion Cubic Feet) | |||||
| Decade | Year-0 | Year-1 | Year-2 | Year-3 | Year-4 | Year-5 | Year-6 | Year-7 | Year-8 | Year-9 |
|---|---|---|---|---|---|---|---|---|---|---|
| 1970's | 11,457 | 10,992 | 10,243 | |||||||
| 1980's | 9,508 | 9,860 | 9,724 | 9,553 | 9,387 | 9,337 | 10,509 | 10,494 | 10,104 | 10,091 |
| 1990's | 9,614 | 9,358 | 9,681 | 9,348 | 9,156 | 8,571 | 7,694 | 6,989 | 6,402 | 5,753 |
| 2000's | 5,299 | 5,101 | 4,983 | 4,819 | 4,652 | 4,314 | 3,931 | 3,982 | 3,557 | 3,279 |
| 2010's | 3,673 | 3,486 | 3,308 | 3,592 | 4,359 | 3,183 | 2,821 | 2,654 | 2,449 | 2,125 |
| 2020's | 1,989 | 2,267 |
| - = No Data Reported; -- = Not Applicable; NA = Not Available; W = Withheld to avoid disclosure of individual company data. |
| Release Date: 12/30/2022 |
| Next Release Date: 12/29/2023 |