|
Download Data (XLS File) |
|
|||||
|
|||||
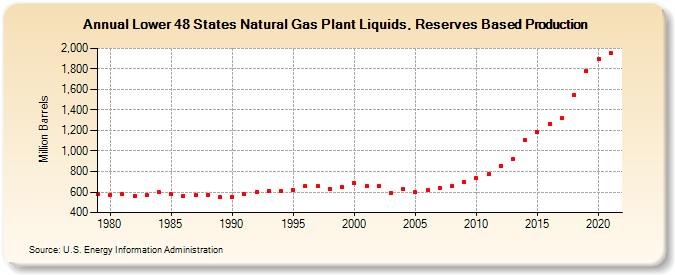
| Lower 48 States Natural Gas Plant Liquids, Reserves Based Production (Million Barrels) | |||||
| Decade | Year-0 | Year-1 | Year-2 | Year-3 | Year-4 | Year-5 | Year-6 | Year-7 | Year-8 | Year-9 |
|---|---|---|---|---|---|---|---|---|---|---|
| 1970's | 579 | |||||||||
| 1980's | 572 | 580 | 564 | 568 | 597 | 580 | 566 | 569 | 572 | 549 |
| 1990's | 556 | 577 | 599 | 608 | 608 | 616 | 655 | 655 | 631 | 649 |
| 2000's | 688 | 655 | 657 | 593 | 627 | 597 | 615 | 637 | 654 | 701 |
| 2010's | 734 | 773 | 854 | 920 | 1,107 | 1,183 | 1,267 | 1,323 | 1,547 | 1,779 |
| 2020's | 1,896 | 1,952 |
| - = No Data Reported; -- = Not Applicable; NA = Not Available; W = Withheld to avoid disclosure of individual company data. |
| Release Date: 12/30/2022 |
| Next Release Date: 12/29/2023 |
Referring Pages: