|
Download Data (XLS File) |
|
|||||
|
|||||
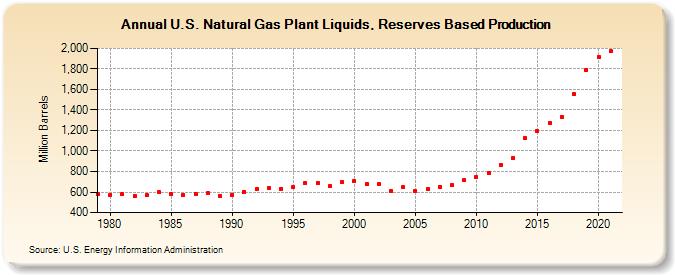
| U.S. Natural Gas Plant Liquids, Reserves Based Production (Million Barrels) | |||||
| Decade | Year-0 | Year-1 | Year-2 | Year-3 | Year-4 | Year-5 | Year-6 | Year-7 | Year-8 | Year-9 |
|---|---|---|---|---|---|---|---|---|---|---|
| 1970's | 580 | |||||||||
| 1980's | 572 | 580 | 564 | 568 | 597 | 585 | 569 | 585 | 592 | 566 |
| 1990's | 574 | 601 | 626 | 635 | 634 | 646 | 688 | 690 | 655 | 697 |
| 2000's | 710 | 675 | 677 | 611 | 645 | 614 | 629 | 650 | 667 | 714 |
| 2010's | 745 | 784 | 865 | 931 | 1,124 | 1,193 | 1,277 | 1,333 | 1,557 | 1,789 |
| 2020's | 1,914 | 1,970 |
| - = No Data Reported; -- = Not Applicable; NA = Not Available; W = Withheld to avoid disclosure of individual company data. |
| Release Date: 12/30/2022 |
| Next Release Date: 12/29/2023 |
Referring Pages: