|
Download Data (XLS File) |
|
|||||
|
|||||
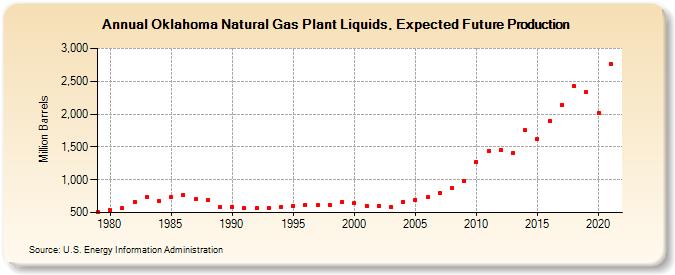
| Oklahoma Natural Gas Plant Liquids, Expected Future Production (Million Barrels) | |||||
| Decade | Year-0 | Year-1 | Year-2 | Year-3 | Year-4 | Year-5 | Year-6 | Year-7 | Year-8 | Year-9 |
|---|---|---|---|---|---|---|---|---|---|---|
| 1970's | 511 | |||||||||
| 1980's | 537 | 565 | 667 | 740 | 683 | 731 | 768 | 702 | 686 | 586 |
| 1990's | 592 | 567 | 566 | 575 | 592 | 605 | 615 | 610 | 613 | 667 |
| 2000's | 639 | 605 | 601 | 582 | 666 | 697 | 732 | 797 | 870 | 985 |
| 2010's | 1,270 | 1,445 | 1,452 | 1,408 | 1,752 | 1,626 | 1,895 | 2,143 | 2,429 | 2,331 |
| 2020's | 2,014 | 2,764 |
| - = No Data Reported; -- = Not Applicable; NA = Not Available; W = Withheld to avoid disclosure of individual company data. |
| Release Date: 12/30/2022 |
| Next Release Date: 12/29/2023 |
Referring Pages: