|
Download Data (XLS File) |
|
|||||
|
|||||
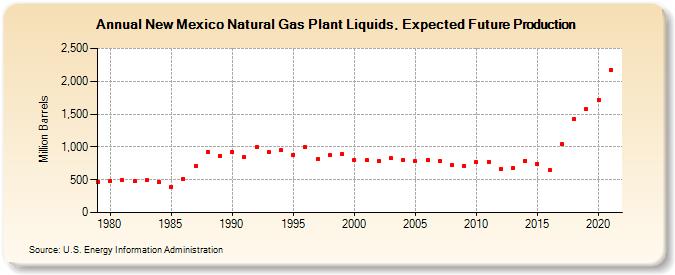
| New Mexico Natural Gas Plant Liquids, Expected Future Production (Million Barrels) | |||||
| Decade | Year-0 | Year-1 | Year-2 | Year-3 | Year-4 | Year-5 | Year-6 | Year-7 | Year-8 | Year-9 |
|---|---|---|---|---|---|---|---|---|---|---|
| 1970's | 465 | |||||||||
| 1980's | 478 | 496 | 475 | 495 | 462 | 395 | 514 | 708 | 926 | 863 |
| 1990's | 915 | 840 | 994 | 925 | 946 | 881 | 998 | 814 | 876 | 896 |
| 2000's | 804 | 794 | 779 | 824 | 805 | 781 | 804 | 788 | 726 | 715 |
| 2010's | 764 | 776 | 662 | 679 | 789 | 740 | 649 | 1,044 | 1,422 | 1,571 |
| 2020's | 1,720 | 2,172 |
| - = No Data Reported; -- = Not Applicable; NA = Not Available; W = Withheld to avoid disclosure of individual company data. |
| Release Date: 12/30/2022 |
| Next Release Date: NA |
Referring Pages: